HTF BIAS FILTER🧭HTF Bias Filter Indicator: 5 in 1 indicator
Technical Overview
The Bias Filter is a comprehensive multi-timeframe tool designed to confirm directional bias using five key indicators before entering a trade. It plots higher-timeframe Moving Averages directly on the chart and provides an immediate status summary via a static dashboard.
The more confluence on the dashboard, the greater the probability of the direction of the trade.
1. 📊 Display Components
A. Plotted Lines
The indicator uses the request.security function to draw Moving Averages from higher timeframes onto your current chart:
1H EMA 21 (Purple): The 21-period Exponential Moving Average calculated on the 1-Hour (60 min) chart. Plotted using a step-line style.
4H EMA 50 (Red): The 50-period Exponential Moving Average calculated on the 4-Hour (240 min) chart. Plotted using a step-line style.
B. Directional Dashboard
A fixed-position summary table is anchored to the bottom-right corner of the chart, providing a quick glance at the current status of all five filters.
2. 🎨 Colour Logic
Each of the five indicators is assigned a colour based on its current directional signal. The more indicators that show the same colour (confluence), the stronger the signal and the higher the likelihood of a high-probability trade.
🟢 Green indicators are signaling UP/BUY (Bullish momentum or trend).
🔴 Red indicators are signaling DOWN/SELL (Bearish momentum or trend).
⚫ Gray indicators are signaling Mixed or flat directions (neutral or undecided).
Note: The dashboard's main header color is determined by a strict confluence logic (All four 4H filters must align for Green/Red), while individual indicator colors follow the simple rules above.
3. 📋 Indicator Breakdown and Logic
The dashboard provides the direction of five different filters.
3.1. Higher-Timeframe (HTF) Trend Indicators
These two signals determine the immediate slope and direction of the primary Moving Averages:
4H EMA 50:
Timeframe: 4-Hour (240 min)
Logic: Compares the current EMA value to the value two bars ago on the 4H chart.
Output: UP ↑, DOWN ↓, or FLAT ⏸
1H EMA 21:
Timeframe: 1-Hour (60 min)
Logic: Compares the current EMA value to the value two bars ago on the 1H chart.
Output: UP ↑, DOWN ↓, or FLAT ⏸
3.2. 4-Hour Confluence Filters
These three indicators provide supplementary confirmation on Volume, Price Position, and Momentum, all calculated on the 4-Hour (240 min) chart:
4H OBV (Smoothed):
Timeframe: 4-Hour (240 min)
Logic: Direction is based on the current value of the 21-bar smoothed On-Balance Volume (OBV) compared to its value nine bars ago.
Output: UP ↑, DOWN ↓, or FLAT ⏸
4H ATR DIR (EMA Proxy):
Timeframe: 4-Hour (240 min)
Logic: Determines the price position by comparing the current Close price against the 4H EMA 50.
Output: BUY 🟢 (Close > EMA 50), SELL 🔴 (Close < EMA 50), or FLAT ⏸️ (Close = EMA 50).
4H RSI (14):
Timeframe: 4-Hour (240 min)
Logic: Momentum check comparing the 14-period Relative Strength Index (RSI) value against the 50 level.
Output: BUY 🟢 (RSI > 50), SELL 🔴 (RSI < 50), or FLAT ⏸️ (RSI = 50).
Search in scripts for "Up down"

Chop + MSS/FVG Retest (Ace v1.6) – IndicatorWhat this indicator does
Name: Chop + MSS/FVG Retest (Ace v1.6) – Indicator
This is an entry model helper, not just a BOS/MSS marker.
It looks for clean trend-side setups by combining:
MSS (Market Structure Shift) using swing highs/lows
3-bar ICT Fair Value Gaps (FVG)
First retest back into the FVG
A built-in chop / trend filter based on ATR and a moving average
When everything lines up, it plots:
L below the candle = Long candidate
S above the candle = Short candidate
You pair this with a higher-timeframe filter (like the Chop Meter 1H/30M/15M) to avoid pressing the button in garbage environments.
How it works (simple explanation)
Chop / Trend filter
Computes ATR and compares each bar’s range to ATR.
If the bar is small vs ATR → more likely CHOP.
If the bar is big vs ATR → more likely TREND.
Uses a moving average:
Above MA + TREND → trendLong zone
Below MA + TREND → trendShort zone
MSS (Market Structure Shift)
Uses swing highs/lows (left/right bars) to track the last significant high/low.
Bullish MSS: close breaks above last swing high with displacement.
Bearish MSS: close breaks below last swing low with displacement.
Those events are marked as tiny triangles (MSS up/down).
A MSS only stays “valid” for a certain number of bars (Bars after MSS allowed).
3-bar ICT FVG
Bullish FVG: low > high
→ gap between bar 3 high and bar 2 low.
Bearish FVG: high < low
→ gap between bar 3 low and bar 2 high.
The indicator stores the FVG boundaries (top/bottom).
Retest of FVG
Watches for price to trade back into that gap (first touch).
That retest is the “entry zone” after the MSS.
Final Long / Short condition
Long (L) prints when:
Recent bullish MSS
Bullish FVG has formed
Price retests the bullish FVG
Environment = trendLong (ATR + above MA)
Not CHOP
Short (S) prints when:
Recent bearish MSS
Bearish FVG has formed
Price retests the bearish FVG
Environment = trendShort (ATR + below MA)
Not CHOP
So the L/S markers are “model-approved entry candles”, not just any random BOS.
Inputs / Settings
Key inputs you’ll see:
ATR length (chop filter)
How many bars to use for ATR in the chop / trend filter.
Lower = more sensitive, twitchy
Higher = smoother, slower to change
Max chop ratio
If barRange / ATR is below this → treat as CHOP.
Min trend ratio
If barRange / ATR is above this → treat as TREND.
Hide MSS/BOS marks in CHOP?
ON = MSS triangles disappear when the bar is classified as CHOP
Keeps your chart cleaner in consolidation
Swing left / right bars
Controls how tight or wide the swing highs/lows are for MSS:
Smaller = more sensitive, more MSS points
Larger = fewer, more significant swings
Bars after MSS allowed
How many bars after a MSS the indicator will still allow FVG entries.
Small value (e.g. 10) = MSS must deliver quickly or it’s ignored.
Larger (e.g. 20) = MSS idea stays “in play” longer.
Visual RR (for info only)
Just for plotting relative risk-reward in your head.
This is not a strategy tester; it doesn’t manage positions.
What you see on the chart
Small green triangle up = Bullish MSS
Small red triangle down = Bearish MSS
“L” triangle below a bar = Long idea (MSS + FVG retest + trendLong + not chop)
“S” triangle above a bar = Short idea (MSS + FVG retest + trendShort + not chop)
Faint circle plots on price:
When the filter sees CHOP
When it sees Trend Long zone
When it sees Trend Short zone
You do not have to trade every L or S.
They’re there to show “this is where the model would have considered an entry.”
How to use it in your trading
1. Use it with a higher-timeframe filter
Best practice:
Use this with the Chop Meter 1H/30M/15M or some other HTF filter.
Only consider L/S when:
Chop Meter = TRADE / NORMAL, and
This indicator prints L or S in the right location (premium/discount, near OB/FVG, etc.)
If higher-timeframe says NO TRADE, you ignore all L/S.
2. Location > Signal
Treat L/S as confirmation, not the whole story.
For shorts (S):
Look for premium zones (previous highs, OBs, fair value ranges above mid).
Want purge / raid of liquidity + MSS down + bearish FVG retest → then S.
For longs (L):
Look for discount zones (previous lows, OBs/FVGs below mid).
Want stop raid / purge low + MSS up + bullish FVG retest → then L.
If you see L/S firing in the middle of a bigger range, that’s where you skip and let it go.
3. Instrument presets (example)
You can tune the ATR/chop settings per instrument:
MNQ (noisy, 1m chart):
ATR length: 21
Max chop ratio: 0.90
Min trend ratio: 1.40
Bars after MSS allowed: 10
GOLD (cleaner, 3m chart):
ATR length: 14
Max chop ratio: 0.80
Min trend ratio: 1.30
Bars after MSS allowed: 20
You can save those as presets in the TV settings for quick switching.
4. How to practice with it
Open replay on a couple of days.
Check Chop Meter → if NO TRADE, just observe.
When Chop Meter says TRADE:
Mark where L/S printed.
Ask:
Was this in premium/discount?
Was there SMT / purge on HTF?
Did the move actually deliver, or did it die?
Screenshot the A+ L/S and the ugly ones; refine:
ATR length
Chop / trend thresholds
MSS lookback
Your goal is to get it to where:
The L/S marks show up mostly in the same places your eye already likes,
and you ignore the rest.

MTF EMA Directional Bias -1hr and 4hr A compact, fixed-position table (bottom-right corner) that shows the current slope direction of two higher-timeframe EMAs:
4H EMA 50 → direction over the last 2 bars (UP ↑, DOWN ↓, or FLAT ⏸)
1H EMA 21 → direction over the last 2 bars (UP ↑, DOWN ↓, or FLAT ⏸)
Background color logic:
Green → both 4H and 1H EMAs are sloping upward
Red → both 4H and 1H EMAs are sloping downward
Gray → mixed or flat directions (no confluence)
Additionally draws the actual 1H EMA-21 (purple) and 4H EMA-50 (red) as step-lines on the chart.

Combined: RSI Swing + Div + Sentiment + CCI — v6RSI Swing Structure (LL, LH, HH, HL)
✅ RSI Sentiment Direction (Up / Down)
✅ CCI Steroid Direction (Up / Down)
✅ Buy Signal when:
RSI Swing makes LL or HL, AND
RSI Sentiment trending UP, AND
CCI trending UP
✅ Sell Signal when:
RSI Swing makes HH or LH, AND
RSI Sentiment trending DOWN, AND
CCI trending DOWN

Smart Swing & Order Block Pro v1📌 Smart Swing & Order Block Pro v1
The Smart Swing & Order Block Pro v1 indicator is an advanced tool designed for traders who use Smart Money Concepts, institutional analysis, and deep market-structure reading. It combines precise Order Block detection, intelligent classification, reliable swing identification, and professional volume/delta filtering to deliver a clean, structured, and actionable view of price behavior.
🎯 Indicator Purpose
Provide a consistent, clean, and verifiable identification of institutional zones (OBs), their evolution over time, their break and mitigation events, and a complete structural reading of swings and trend direction.
This indicator replaces the typical noise found in standard OB tools with a robust system based on:
OBs validated by volume and delta
Dynamic OB classification (Extreme, Mitigated, Breaker, Intermediate)
Clean visual separation between intact and broken OBs
Accurate Swing High / Swing Low detection using dynamic pivots
Visual panels with quantitative swing and OB statistics
🧠 Key Features
1. Precision Order Block Detection
The indicator identifies bullish and bearish Order Blocks using a combination of:
Market structure
Validated breakouts
Optional filtering via relative volume (RVOL)
Normalized delta filtering to measure directional intent
This prevents low-quality or non-institutional OBs from being drawn.
2. Intelligent OB Classification
Each detected OB is automatically assigned a structural role:
🔹 Extreme OB
The origin point of a movement (up leg or down leg).
Crucial for spotting institutional footprints and major displacement zones.
🔹 Mitigated OB
An OB already tapped or partially consumed by price.
Useful for identifying weakened zones or controlled pullbacks.
🔹 Breaker OB
An OB broken by price in the opposite direction.
The box is visually split into two parts:
Left section → original OB color
Right section → breaker color
🔹 Intermediate OB
Active OBs that do not meet the criteria above.
3. Professional OB Visualization
OBs automatically extend to the right.
Broken OBs show a clear color split (intact vs. breaker).
Mitigated OBs update color automatically.
Extreme OBs are highlighted with a special color.
Automatic cleanup of boxes and lines for performance and clarity.
4. Ultra-Precise Swing Detection
Unlike standard swing indicators:
Uses configurable pivot strengths
Marks the exact candle that created the swing
Avoids excessive false signals
Draws clean swing-high and swing-low lines
Places crosses exactly when price breaks a swing
This results in a perfectly readable structure (HH, HL, LH, LL).
5. Dynamic Panels
The script includes two optional informational panels:
📊 Swing Panel
Displays:
Average bars between swing highs
Average bars between swing lows
Current trend based on structure (UP / DOWN / RANGE)
📉 OB Panel
Displays counts of:
Bullish Extreme
Bullish Mitigated
Bearish Extreme
Bearish Mitigated
Perfect for evaluating institutional strength and directional bias.
⚙️ Configurable Options
Swing strength (independent lookback for high/low)
Use of candle body vs. wicks
Volume/delta filter modes (Strict, Normal, Loose)
Toggle visibility of OBs, swings, and panels
Color themes per OB classification
Panel positioning (Top Left / Top Right)
🎨 Clean and Professional Visualization
The indicator focuses on:
Clarity
Structural accuracy
Immediate interpretability
Institutional-grade behavior
Real reaction zones
Nothing unnecessary, nothing noisy — just clean structure.
🚀 Who Is This Indicator For?
Ideal for traders using:
Smart Money Concepts (SMC)
ICT-style analysis
Wyckoff methodology
Order Flow
Swing trading based on structure
Algorithmic OB logic
Strategies based on breakers, traps, and displacement
Paneles gráficos informativos sobre swings y OB.
🧠 Funcionalidades Principales
1. Detección Precisa de Order Blocks (OB)
El indicador identifica OB alcistas y bajistas usando una combinación de:
Estructura de precio
Rupturas validadas
Filtro opcional por volumen relativo (RVOL)
Filtro por delta normalizado (direccionalidad del cuerpo de la vela)
Esto evita identificar OB sin relevancia institucional.
2. Clasificación Inteligente de OB
Cada OB detectado recibe una etiqueta automática según su importancia estructural:
🔹 Extreme
Es el OB origen del movimiento (up leg o down leg).
Fundamental para identificar desplazamientos fuertes y zonas institucionales críticas.
🔹 Mitigated
OB ya tocado, parcialmente consumido o con interacción del precio.
Ideal para detectar zonas debilitadas o retrocesos controlados.
🔹 Breaker
OB que fue roto por el precio en sentido contrario.
La caja se divide visualmente en dos colores:
Parte izquierda = color del OB original
Parte derecha = color de breaker
🔹 Intermediate
OB activos que aún no pertenecen a las categorías anteriores.
3. Visualización Profesional de Order Blocks
Los OB se extienden hacia la derecha.
Los breakers se dividen en color original y color de ruptura.
Los OB mit igados cambian automáticamente de color.
Los OB extremos destacan con un color especial.
Limpieza automática de cajas y líneas.
4. Swings Ultra Precisos
A diferencia del detector estándar de swings:
Usa pivotes configurables
Marca correctamente la vela que originó el swing
Evita el exceso de falsos positivos
Genera líneas limpias de swing high y low
Coloca cruces exactamente donde el precio rompe el swing
Esto permite medir estructura (HH, HL, LH, LL) de forma clara.
5. Paneles Dinámicos
El script incorpora dos paneles opcionales:
📊 Panel de Swings
Incluye:
Promedio de barras entre swings high
Promedio de barras entre swings low
Tendencia actual basada en estructura (UP / DOWN / RANGE)
📉 Panel de OB
Muestra conteos de:
Bullish Extreme
Bullish Mitigated
Bearish Extreme
Bearish Mitigated
Ideal para medir fuerza institucional y bias del mercado.
⚙️ Opciones Ajustables
Fuerza del swing (lookback independiente para high/low)
Uso del cuerpo/candlestick o mechas en la lógica
Filtro de volumen/delta (Strict, Normal, Loose)
Visualización de OB, Swings y Paneles
Estilos de color por cada tipo de OB
Posición de paneles (Top Left / Top Right)
🎨 Visualización Limpia y Profesional
El indicador prioriza:
Claridad
Estructura
Lectura inmediata
Comportamiento “institucional”
Zonas de reacción reales
No pinta elementos innecesarios y mantiene un diseño elegante y minimalista.
🚀 ¿Para quién está diseñado?
Ideal para traders que utilizan:
Smart Money Concepts
Wyckoff
Order Flow
ICT / SMC
Swing trading basado en estructura
Trading algorítmico basado en OB
Estrategias basadas en trampas y breakers

Smart Margin Zone
SMART MARGIN ZONE - CME-BASED SUPPORT & RESISTANCE INDICATOR
TITLE FOR PUBLICATION:
Smart Margin Zone - CME Margin-Based Support and Resistance
CATEGORY:
Support and Resistance
SHORT DESCRIPTION (for preview):
Automatically plots margin zones based on CME Group requirements. These zones represent critical price levels where leveraged traders face margin calls, creating natural support and resistance through forced liquidations.
═══════════════════════════════════════════════════════════════
FULL DESCRIPTION FOR TRADINGVIEW:
═══════════════════════════════════════════════════════════════
📊 Smart Margin Zone - Professional Trading Zones Based on CME Data
This indicator automatically calculates and displays margin zones derived from official CME Group margin requirements. These zones represent critical price levels where traders using leverage receive margin calls, triggering forced position closures that create natural support and resistance levels.
═══════════════════════════════════════════════════════════════
🎯 CORE CONCEPT
═══════════════════════════════════════════════════════════════
When price reaches calculated margin zones, traders using 2:1 or 4:1 leverage on CME futures receive margin calls. Brokers automatically liquidate these positions, creating waves of buying or selling pressure that form strong support and resistance levels.
This is not theoretical - it's based on actual margin requirements from CME Group, the world's largest derivatives marketplace.
═══════════════════════════════════════════════════════════════
📐 CALCULATION METHODOLOGY
═══════════════════════════════════════════════════════════════
The indicator uses the following formula to calculate zone sizes:
Zone Size = (Margin Requirement / Tick Value) × Tick Size × 1.10
Where:
• Margin Requirement = Official CME initial margin (updated November 2024)
• Tick Value = Dollar value of minimum price movement
• Tick Size = Minimum price increment
• 1.10 = 10% buffer for realistic zone width
SUPPORTED INSTRUMENTS WITH CME DATA:
Currency Pairs:
• EURUSD: $2,100 margin → 0.0168 zone size
• GBPUSD: $1,800 margin → 0.0144 zone size
• AUDUSD: $1,300 margin → 0.0065 zone size
• NZDUSD: $1,100 margin → 0.0055 zone size
• USDJPY: $3,200 margin → custom calculation
• USDCAD: $950 margin → calculated
• USDCHF: $1,650 margin → calculated
Commodities:
• Gold (XAUUSD): $8,000 margin → 80 points zone size
• Silver (XAGUSD): $6,500 margin → calculated
• WTI Crude Oil: $4,500 margin → calculated
═══════════════════════════════════════════════════════════════
🔍 HOW IT WORKS
═══════════════════════════════════════════════════════════════
1. SWING POINT DETECTION
The indicator automatically identifies swing highs and swing lows using a configurable lookback period (default 10 bars). These become anchor points for zone calculations.
2. FIVE ZONE LEVELS
From each swing point, five zone levels are calculated:
• Zone 1/4 (25%) - First correction level
• Zone 1/2 (50%) - KEY ZONE for trend determination
• Zone 3/4 (75%) - Intermediate level
• Zone 1/1 (100%) - Full margin zone (strongest level)
• Zone 5/4 (125%) - Extended zone
3. TREND IDENTIFICATION
• Close above Zone 1/2 resistance = Bullish trend
• Close below Zone 1/2 support = Bearish trend
• Between zones = Range/consolidation
4. HISTORICAL CONTEXT
Current zones are displayed prominently with fills and labels. Historical zones appear as thin, semi-transparent lines for context without cluttering the chart.
═══════════════════════════════════════════════════════════════
⚙️ FEATURES
═══════════════════════════════════════════════════════════════
AUTOMATED CALCULATION:
✅ Auto-detection of swing highs and lows
✅ Real-time zone updates as new swings form
✅ CME margin data built-in for major instruments
✅ Manual override option for custom calculations
VISUAL CLARITY:
✅ Color-coded zones (red=resistance, green=support)
✅ Adjustable transparency for fills and lines
✅ Current zones bold with fills and price labels
✅ Historical zones thin and transparent
✅ Swing point markers show calculation origins
CUSTOMIZATION:
✅ Show/hide individual zone levels (1/4, 1/2, 3/4, 1/1, 5/4)
✅ Toggle historical zones on/off
✅ Adjustable lookback period (5-50 bars)
✅ Customizable colors for all elements
✅ Line width and transparency controls
✅ Zone extension options (none/right/both)
TREND ANALYSIS:
✅ Optional trend background coloring
✅ Customizable trend colors and transparency
✅ Real-time trend identification display
STATISTICS:
✅ Live statistics table showing:
- Current instrument
- Active zone size
- Calculation mode
- Current trend direction
- Number of zones displayed
ALERTS:
✅ Zone 1/2 breakout (up/down)
✅ Full margin zone 1/1 reached
✅ Customizable alert messages
═══════════════════════════════════════════════════════════════
📈 TRADING APPLICATIONS
═══════════════════════════════════════════════════════════════
ENTRY SIGNALS:
• Bounces from zone levels = potential entry points
• Zone 1/2 breakouts = trend continuation entries
• Zone rejections = reversal opportunities
RISK MANAGEMENT:
• Zone levels = logical stop-loss placement
• Zone 1/1 = maximum risk level
• Zone spacing = position sizing guide
PROFIT TARGETS:
• Next zone level = first target
• Zone 1/1 = full profit target
• Zone breakouts = extended targets
TREND CONFIRMATION:
• Price above Zone 1/2 resistance = confirmed uptrend
• Price below Zone 1/2 support = confirmed downtrend
• Consolidation between zones = wait for breakout
═══════════════════════════════════════════════════════════════
📚 USAGE INSTRUCTIONS
═══════════════════════════════════════════════════════════════
GETTING STARTED:
1. Add indicator to chart of any supported instrument
2. Zones automatically calculate and display
3. Adjust swing detection period if needed (default 10 works well)
4. Customize colors and visibility to your preference
OPTIMAL SETTINGS:
• Best timeframes: H1, H4, Daily, Weekly
• Default swing length (10) suitable for most markets
• Show 2-3 historical zones for context
• Enable swing point markers to see calculation origins
INTERPRETATION:
• Watch for price reactions at zone boundaries
• Strong bounces = respect for margin level
• Clean breaks = momentum continuation
• Multiple touches = zone strength confirmation
SET ALERTS:
• Zone 1/2 breakouts for trend entries
• Zone 1/1 reaches for profit-taking
• Custom alerts for your specific strategy
═══════════════════════════════════════════════════════════════
⚠️ IMPORTANT NOTES
═══════════════════════════════════════════════════════════════
DATA ACCURACY:
• CME margin requirements updated November 2024
• Margins change periodically - check CME Group website
• Manual mode available for latest margin data
• Indicator provides analysis tool, not financial advice
STATISTICAL PERFORMANCE:
• Historical data shows >60% probability of continued movement after Zone 1/2 breakout
• Zone effectiveness varies by market conditions
• Best results in trending markets with clear swings
LIMITATIONS:
• Margin requirements change - monitor CME updates
• Works best on liquid instruments with clear swings
• Not a standalone trading system
• Should be combined with additional analysis
═══════════════════════════════════════════════════════════════
🔧 METHODOLOGY CREDIT
═══════════════════════════════════════════════════════════════
This indicator is based on the margin zones concept developed by Alexander Bazylev (BTrade indicator for MetaTrader platforms).
The TradingView implementation has been completely rewritten with original enhancements:
• Multiple zone levels instead of single level
• Automatic swing point detection algorithm
• Direct CME data integration
• Historical zone visualization
• Advanced customization options
• Comprehensive statistics and alerts
All code is original and specifically designed for TradingView's Pine Script v5 environment.
═══════════════════════════════════════════════════════════════
💡 BEST PRACTICES
═══════════════════════════════════════════════════════════════
COMBINE WITH:
• Volume analysis for confirmation
• Trend indicators for direction bias
• Price action patterns at zones
• Higher timeframe analysis
AVOID:
• Trading against strong trends at minor zones
• Over-leveraging based solely on zone placement
• Ignoring broader market context
• Expecting perfect bounces every time
OPTIMIZE:
• Adjust swing length for different timeframes
• Shorter period (5-7) for intraday trading
• Longer period (15-20) for swing trading
• Test historical effectiveness on your instruments
═══════════════════════════════════════════════════════════════
📖 EDUCATIONAL VALUE
═══════════════════════════════════════════════════════════════
This indicator helps traders understand:
• How institutional margin requirements affect price
• Where forced liquidations create pressure
• Natural support and resistance formation
• Relationship between leverage and price levels
• Market structure and key technical levels
═══════════════════════════════════════════════════════════════
🔄 VERSION HISTORY
═══════════════════════════════════════════════════════════════
Version 1.0 (Initial Release):
• CME-based zone calculation for 10 instruments
• Automatic swing high/low detection
• 5 zone levels with customizable display
• Historical zones with transparency control
• Swing point markers
• Trend background indicator
• Live statistics table
• Multiple alert conditions
• Fully customizable colors and styles
• English language interface
═══════════════════════════════════════════════════════════════
📞 SUPPORT & FEEDBACK
═══════════════════════════════════════════════════════════════
Questions or suggestions? Leave a comment below!
If you find this indicator useful:
⭐ Please leave a like
💬 Share your experience in comments
🔔 Follow for updates and new indicators
═══════════════════════════════════════════════════════════════
⚖️ DISCLAIMER
═══════════════════════════════════════════════════════════════
This indicator is provided for educational and analytical purposes only. It is not financial advice and should not be the sole basis for trading decisions.
• Past performance does not guarantee future results
• Trading involves substantial risk of loss
• CME margin requirements subject to change
• Always do your own research and risk management
• Consult a financial advisor for investment advice
The creator is not responsible for any trading losses incurred through use of this indicator.

FxAST Ichi ProSeries Enhanced Full Market Regime EngineFxAST Ichi ProSeries v1.x is a modernized Ichimoku engine that keeps the classic logic but adds a full market regime engine for any market and instrument.”
Multi-timeframe cloud overlay
Oracle long-term baseline
Trend regime classifier (Bull / Bear / Transition / Range)
Chikou & Cloud breakout signals
HTF + Oracle + Trend dashboard
Alert-ready structure for automation
No repainting: all HTF calls use lookahead_off.
1. Core Ichimoku Engine
Code sections:
Input group: Core Ichimoku
Function: ichiCalc()
Variables: tenkan, kijun, spanA, spanB, chikou
What it does
Calculates the classic Ichimoku components:
Tenkan (Conversion Line) – fast Donchian average (convLen)
Kijun (Base Line) – slower Donchian average (baseLen)
Senkou Span A (Span A / Lead1) – (Tenkan + Kijun)/2
Senkou Span B (Span B / Lead2) – Donchian over spanBLen
Chikou – current close shifted back in time (displace)
Everything else in the indicator builds on this engine.
How to use it (trading)
Tenkan vs Kijun = short-term vs medium-term balance.
Tenkan above Kijun = short-term bullish control; below = bearish control.
Span A / B defines the cloud, which represents equilibrium and support/resistance.
Price above cloud = bullish bias; price below cloud = bearish bias.
Graphic
2. Display & Cloud Styling
Code sections:
Input groups: Display Options, Cloud Styling, Lagging Span & Signals
Variables: showTenkan, showKijun, showChikou, showCloud, bullCloudColor, bearCloudColor, cloudLineWidth, laggingColor
Plots: plot(tenkan), plot(kijun), plot(chikou), p1, p2, fill(p1, p2, ...)
What it does
Lets you toggle individual components:
Show/hide Tenkan, Kijun, Chikou, and the cloud.
Customize cloud colors & opacity:
bullCloudColor when Span A > Span B
bearCloudColor when Span A < Span B
Adjust cloud line width for clarity.
How to use it
Turn off components you don’t use (e.g., hide Chikou if you only want cloud + Tenkan/Kijun).
For higher-timeframe or noisy charts, use thicker Kijun & cloud so structure is easier to see.
Graphic
Before
After
3. HTF Cloud Overlay (Multi-Timeframe)
Code sections:
Input group: HTF Cloud Overlay
Vars: showHTFCloud, htfTf, htfAlpha
Logic: request.security(..., ichiCalc(...)) → htfSpanA, htfSpanB
Plots: pHTF1, pHTF2, fill(pHTF1, pHTF2, ...)
What it does
Pulls higher-timeframe Ichimoku cloud (e.g., 1H, 4H, Daily) onto your current chart.
Uses the same Ichimoku settings but aggregates on htfTf.
Plots an extra, semi-transparent cloud ahead of price:
Greenish when HTF Span A > Span B
Reddish when HTF Span B > Span A
How to use it
Trade LTF (e.g., 5m/15m) only in alignment with HTF trend:
HTF cloud bullish + LTF Ichi bullish → look for longs
HTF cloud bearish + LTF Ichi bearish → look for shorts
Treat HTF cloud boundaries as major S/R zones.
Graphic
4. Oracle Module
Code sections:
Input group: Oracle Module
Vars: useOracle, oracleLen, oracleColor, oracleWidth, oracleSlopeLen
Logic: oracleLine = donchian(oracleLen); slope check vs oracleLine
Plot: plot(useOracle ? oracleLine : na, "Oracle", ...)
What it does
Creates a long-term Donchian baseline (default 208 bars).
Uses a simple slope check:
Current Oracle > Oracle oracleSlopeLen bars ago → Oracle Bull
Current Oracle < Oracle oracleSlopeLen bars ago → Oracle Bear
Slope state is also shown in the dashboard (“Bull / Bear / Flat”).
How to use it
Think of Oracle as your macro anchor :
Only take longs when Oracle is sloping up or flat.
Only take shorts when Oracle is sloping down or flat.
Works well combined with HTF cloud:
HTF cloud bullish + Oracle Bull = higher conviction long bias.
Ideal for Gold / Indices swing trades as a trend filter.
Graphic idea
5. Trend Regime Classifier
Code sections:
Input group: Trend Regime Logic
Vars: useTrendRegime, bgTrendOpacity, minTrendScore
Logic:
priceAboveCloud, priceBelowCloud, priceInsideCloud
Tenkan vs Kijun alignment
Cloud bullish/bearish
bullScore / bearScore (0–3)
regime + regimeLabel + regimeColor
Visuals: bgcolor(regimeColor) and optional barcolor() in priceColoring mode.
What it does
Scores the market in three dimensions :
Price vs Cloud
Tenkan vs Kijun
Cloud Direction (Span A vs Span B)
Each condition contributes +1 to either bullScore or bearScore .
Then:
Bull regime when:
bullScore >= minTrendScore and bullScore > bearScore
Price in cloud → “Range”
Everything else → “Transition”
These regimes are shown as:
Background colors:
Teal = Bull
Maroon = Bear
Orange = Range
Silver = Transition
Optional candle recoloring when priceColoring = true.
How to use it
Filters:
Only buy when regime = Bull or Transition and Oracle/HTF agree.
Only sell when regime = Bear or Transition and Oracle/HTF agree.
No trade zone:
When regime = Range (price inside cloud), avoid new entries; wait for break.
Aggressiveness:
Adjust minTrendScore to be stricter (3) or looser (1).
Graphic
6. Signals: Chikou & Cloud Breakout
Code sections :
Logic:
chikouBuySignal = ta.crossover(chikou, close)
chikouSellSignal = ta.crossunder(chikou, close)
cloudBreakUp = priceInsideCloud and priceAboveCloud
cloudBreakDown = priceInsideCloud and priceBelowCloud
What it does
1. Two key signal groups:
Chikou Cross Signals
Buy when Chikou crosses up through price.
Sell when Chikou crosses down through price.
Classic Ichi confirmation idea: Chikou breaking free of price cluster.
2. Cloud Breakout Signals
Long trigger: yesterday inside cloud → today price breaks above cloud.
Short trigger: yesterday inside cloud → today price breaks below cloud.
Captures “equilibrium → expansion” moves.
These are conditions only in this version (no chart shapes yet) but are fully wired for alerts. (Future Updates)
How to use it
Use Chikou signals as confirmation, not standalone entries:
Eg., Bull regime + Oracle Bull + cloud breakout + Chikou Buy.
Use Cloud Breakouts to catch the first impulsive leg after consolidation.
Graphic
7. Alerts (Automation Ready)
[
b]Code sections:
Input group: Alerts
Vars: useAlertTrend, useAlertChikou, useAlertCloudBO
Alert lines like: "FxAST Ichi Bull Trend", "FxAST Ichi Bull Trend", "FxAST Ichi Cloud Break Up"
What it does
Provides ready-made alert hooks for:
Trend regime (Bull / Bear)
Chikou cross buy/sell
Cloud breakout up/down
Each type can be globally toggled on/off via the inputs (helpful if a user only wants one kind).
How to use it
In TradingView: set alerts using “Any alert() function call” on this indicator.
Then filter which ones fire by:
Turning specific alert toggles on/off in input panel, or
Filtering text in your external bot / webhook side.
Example simple workflow ---> Indicator ---> TV Alert ---> Webhook ---> Bot/Broker
8. FxAST Dashboard
Code sections:
Input group: Dashboard
Vars: showDashboard, dashPos, dash, dashInit
Helper: getDashPos() → position.*
Table cells (updated on barstate.islast):
Row 0: Regime + label
Row 1: Oracle status (Bull / Bear / Flat / Off)
Row 2: HTF Cloud (On + TF / Off)
Row 3: Scores (BullScore / BearScore)
What it does
Displays a compact panel with the state of the whole system :
Current Trend Regime (Bull / Bear / Transition / Range)
Oracle slope state
Whether HTF Cloud is active + which timeframe
Raw Bull / Bear scores (0–3 each)
Position can be set: Top Right, Top Left, Bottom Right, Bottom Left.
How to use it
Treat it like a pilot instrument cluster :
Quick glance: “Are my trend, oracle and HTF all aligned?”
Great for streaming / screenshots: everything important is visible in one place without reading the code.
Graphic (lower right of chart )

High Volume Bars (Advanced)High Volume Bars (Advanced)
High Volume Bars (Advanced) is a Pine Script v6 indicator for TradingView that highlights bars with unusually high volume, with several ways to define “unusual”:
Classic: volume > moving average + N × standard deviation
Change-based: large change in volume vs previous bar
Z-score: statistically extreme volume values
Robust mode (optional): median + MAD, less sensitive to outliers
It can:
Recolor candles when volume is high
Optionally highlight the background
Optionally plot volume bands (center ± spread × multiplier)
⸻
1. How it works
At each bar the script:
Picks the volume source:
If Use Volume Change vs Previous Bar? is off → uses raw volume
If on → uses abs(volume - volume )
Computes baseline statistics over the chosen source:
Lookback bars
Moving average (SMA or EMA)
Standard deviation
Optionally replaces mean/std with robust stats:
Center = median (50th percentile)
Spread = MAD (median absolute deviation, scaled to approx σ)
Builds bands:
upper = center + spread * multiplier
lower = max(center - spread * multiplier, 0)
Flags a bar as “high volume” if:
It passes the mode logic:
Classic abs: volume > upper
Change mode: abs(volume - volume ) > upper
Z-score mode: z-score ≥ multiplier
AND the relative filter (optional): volume > average_volume * Min Volume vs Avg
AND it is past the first Skip First N Bars from the start of the chart
Colors the bar and (optionally) the background accordingly.
⸻
2. Inputs
2.1. Statistics
Lookback (len)
Number of bars used to compute the baseline stats (mean / median, std / MAD).
Typical values: 50–200.
StdDev / Z-Score Multiplier (mult)
How far from the baseline a bar must be to count as “high volume”.
In classic mode: volume > mean + mult × std
In z-score mode: z ≥ mult
Typical values: 1.0–2.5.
Use EMA Instead of SMA? (smooth_with_ema)
Off → uses SMA (slower but smoother).
On → uses EMA (reacts faster to recent changes).
Use Robust Stats (Median & MAD)? (use_robust)
Off → mean + standard deviation
On → median + MAD (less sensitive to a few insane spikes)
Useful for assets with occasional volume blow-ups.
⸻
2.2. Detection Mode
These inputs control how “unusual” is defined.
• Use Volume Change vs Previous Bar? (mode_change)
• Off (default) → uses absolute volume.
• On → uses abs(volume - volume ).
You then detect jumps in volume rather than absolute size.
Note: This is ignored if Z-Score mode is switched on (see below).
• Use Z-Score on Volume? (Overrides change) (mode_zscore)
• Off → high volume when raw value exceeds the upper band.
• On → computes z-score = (value − center) / spread and flags a bar as high when z ≥ multiplier.
Z-score mode can be combined with robust stats for more stable thresholds.
• Min Volume vs Avg (Filter) (min_rel_mult)
An extra filter to ignore tiny-volume bars that are statistically “weird” but not meaningful.
• 0.0 → no filter (all stats-based candidates allowed).
• 1.0 → high-volume bar must also be at least equal to average volume.
• 1.5 → bar must be ≥ 1.5 × average volume.
• Skip First N Bars (from start of chart) (skip_open_bars)
Skips the first N bars of the chart when evaluating high-volume conditions.
This is mostly a safety / cosmetic option to avoid weird behavior on very early bars or backfill.
⸻
2.3. Visuals
• Show Volume Bands? (show_bands)
• If on, plots:
• Upper band (upper)
• Lower band (lower)
• Center line (vol_center)
These are plotted on the same pane as the script (usually the price chart).
• Also Highlight Background? (use_bg)
• If on, fills the background on high-volume bars with High-Vol Background.
• High-Vol Bar Transparency (0–100) (bar_transp)
Controls the opacity of the high-volume bar colors (up / down).
• 0 → fully opaque
• 100 → fully transparent (no visible effect)
• Up Color (upColor) / Down Color (dnColor)
• Regular bar colors (non high-volume) for up and down bars.
• Up High-Vol Base Color (upHighVolBase) / Down High-Vol Base Color (dnHighVolBase)
Base colors used for high-volume up/down bars. Transparency is applied on top of these via bar_transp.
• High-Vol Background (bgHighVolColor)
Background color used when Also Highlight Background? is enabled.
⸻
3. What gets colored and how
• Bar color (barcolor)
• Up bar:
• High volume → Up High-Vol Color
• Normal volume → Up Color
• Down bar:
• High volume → Down High-Vol Color
• Normal volume → Down Color
• Flat bar → neutral gray
• Background color (bgcolor)
• If Also Highlight Background? is on, high-volume bars get High-Vol Background.
• Otherwise, background is unchanged.
⸻
4. Alerts
The indicator exposes three alert conditions:
• High Volume Bar
Triggers whenever is_high is true (up or down).
• High Volume Up Bar
Triggers only when is_high is true and the bar closed up (close > open).
• High Volume Down Bar
Triggers only when is_high is true and the bar closed down (close < open).
You can use these in TradingView’s “Create Alert” dialog to:
• Get notified of potential breakout / exhaustion bars.
• Trigger webhook events for bots / custom infra.
⸻
5. Recommended presets
5.1. “Classic” high-volume detector (closest to original)
• Lookback: 150–200
• StdDev / Z-Score Multiplier: 1.0–1.5
• Use EMA Instead of SMA?: off
• Use Robust Stats?: off
• Use Volume Change vs Previous Bar?: off
• Use Z-Score on Volume?: off
• Min Volume vs Avg (Filter): 0.0–1.0
Behavior: Flags bars whose volume is notably above the recent average (plus a bit of noise filtering), same spirit as your initial implementation.
⸻
5.2. Volatility-aware (Z-score) mode
• Lookback: 100–200
• StdDev / Z-Score Multiplier: 1.5–2.0
• Use EMA Instead of SMA?: on
• Use Robust Stats?: on (if asset has huge spikes)
• Use Volume Change vs Previous Bar?: off (ignored anyway in z-score mode)
• Use Z-Score on Volume?: on
• Min Volume vs Avg (Filter): 0.5–1.0
Behavior: Flags bars that are “statistically extreme” relative to recent volume behavior, not just absolutely large. Good for assets where baseline volume drifts over time.
⸻
5.3. “Wake-up bar” (volume acceleration)
• Lookback: 50–100
• StdDev / Z-Score Multiplier: 1.0–1.5
• Use EMA Instead of SMA?: on
• Use Robust Stats?: optional
• Use Volume Change vs Previous Bar?: on
• Use Z-Score on Volume?: off
• Min Volume vs Avg (Filter): 0.5–1.0
Behavior: Emphasis on sudden increases in volume rather than absolute size – useful to catch “first active bar” after a quiet period.
⸻
6. Limitations / notes
• Time-of-day effects
The script currently treats the entire chart as one continuous “session”. On 24/7 markets (crypto) this is fine. For regular-session assets (equities, futures), volume naturally spikes at open/close; you may want to:
• Use a shorter Lookback, or
• Add a session-aware filter in a future iteration.
• Illiquid symbols
On very low-liquidity symbols, robust stats (Use Robust Stats) and a non-zero Min Volume vs Avg can help avoid “everything looks extreme” problems.
• Overlay behavior
overlay = true means:
• Bars are recolored on the price pane.
• Volume bands are also drawn on the price pane if enabled.
If you want a dedicated panel for the bands, duplicate the logic in a separate script with overlay = false.

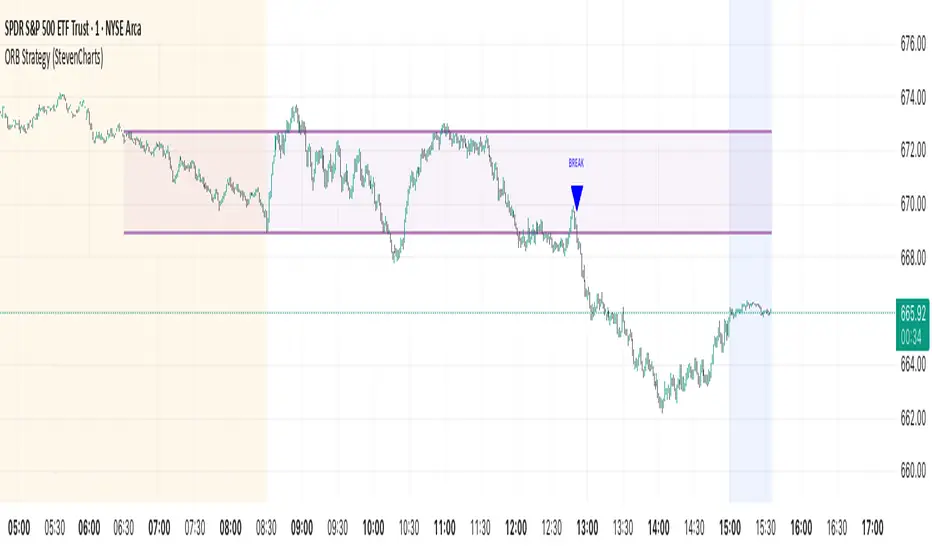
ORB Strategy (StevenCharts)Summary
This is an advanced Opening Range Breakout (ORB) indicator designed for day traders, particularly those trading US equities and futures.
Its primary feature is the ability to define and monitor two separate opening ranges—typically for Pre-Market and the Market Open. The script can then intelligently merge these two ranges into a single "Combined ORB" if they overlap, providing a cleaner and more unified level of support/resistance to trade from.
Core Features
Dual ORB Sessions: Define two independent, fully customizable time sessions (e.g., a Pre-Market range and a 15-min Market Open range).
Intelligent Combined ORB: If the two ranges overlap, the script automatically merges them into a single, larger "Combined ORB" (using the highest high and lowest low of the two). This provides one clear, consolidated range for analysis.
Advanced Price Action Signals: Breakout signals are not just simple line crosses. The logic checks for specific price action patterns, including:
Breakouts
Fakeouts
Retests
Gap-ups/downs
Signal Invalidation Logic: Breakout signals are automatically invalidated (removed from the chart) if the price retraces back to the 50% midline of the source ORB. This helps filter out failed moves and reduce chart clutter.
Volume Filter: All signals can be filtered by volume. A Vol Multiplier input allows you to require that breakout volume is a certain multiple of the 20-period average volume, helping to confirm conviction.
HOD/LOD Lines: Automatically plots the developing High of Day (HOD) and Low of Day (LOD) with labels, which act as key intraday support and resistance levels.
Built-in Alerts: Alerts are included for all long and short breakout signals.
How It Works
The indicator's logic adapts based on your settings:
Single Range Mode: If you select "Pre-Market" or "Market Open" from the settings, the script will only draw and generate signals from that one selected range.
Dual Range Mode: If you select "Both" and the two defined ranges do not overlap, the script will monitor both ranges independently and generate signals from whichever one is broken.
Combined Range Mode: This is the most powerful feature. If you select "Both" and the ranges do overlap, the script creates a new, single range from the highest high and lowest low of the two. All signals are then based on this new, unified range, and the individual ranges are hidden for clarity.
Main Controls
Show: Choose to display "Pre-Market", "Market Open", or "Both".
Show Combined ORB Only: When "Both" is selected, this toggle enables the intelligent merging logic.
50% Midline: Toggles the visibility of the 50% line for all ORBs. This line is also the invalidation level for signals.
Show HOD/LOD Lines: Toggles the High of Day and Low of Day lines.
ORB Settings
Pre-Market Session (EST): Set the start and end time for the first ORB.
Market Open Session (EST): Set the start and end time for the second ORB.
Colors: Full color customization for all three ranges (Pre-Market, Market Open, and Combined).
Breakout Signal Settings
Show: Toggle the "BREAK" signals on or off.
Vol Multiplier: Set the volume filter threshold. A value of 0 turns the filter off. A value of 1.5 means volume must be 1.5x the average.
Breakout Color: Set the color for the signal labels.
Liquidity Hunt Detector PDH/PDL [SmartFoxy]Liquidity Hunt Detector PDH/PDL
The Liquidity Hunt Detector (LHD) is designed to identify and anticipate liquidity grabs around the:
• Previous Day High (PDH);
• Previous Day Low (PDL).
It builds dynamic trigger levels that highlight where price may deliver its first impulse before reaching PDH/PDL.
The Liquidity Hunt Detector (LHD) identifies high-probability reversals and continuations around the Previous Day High (PDH) and Previous Day Low (PDL).
It dynamically tracks the market’s move from the session open, builds trigger levels toward PDH/PDL, and highlights where liquidity is most likely to be taken.
When price taps a Trigger Up/Down level, the indicator generates Long/Short signals with optional confirmation from the integrated MA Ribbon , ensuring only high-quality, trend-aligned setups are shown.
When price interacts with these trigger levels, the indicator generates signals that help traders evaluate the market structure and prepare for potential entries.
Designed for Forex, Crypto, Indices, Stocks , the LHD provides a clean and intuitive structure for navigating intraday liquidity grabs, session impulses, and directional bias shifts.
The indicator is built from three fully independent modules, each of which can be used separately:
Liquidity Hunt Detector (LHD)
Moving Average Ribbon (MA Ribbon)
Previous Day High/Low (PDH/PDL) levels
Liquidity Hunt Detector (LHD) Logic
1.1 Display LHD – Enables or disables the entire Liquidity Hunt Detector module.
1.2 Max Days – Number of previous days used to generate PDH/PDL levels.
1.3 GMT – Corrects all time-based calculations based on your broker/session timezone.
1.4 Calculation Method (Point A Logic)
1) Static Method
Point A = the session’s opening price.
Trigger lines are calculated strictly as a percentage of the move A → PDH or A → PDL.
Intraday fluctuations do not affect the calculation.
2) Dynamic Method
Point A updates using the current intraday high/low:
• If price forms a new low, Point A updates for the PDH-side calculations;
• If price forms a new high, Point A updates for the PDL-side calculations.
This produces trigger lines that reflect the true live market structure rather than a fixed opening reference.
1.5 Main OTT Time (Operational Trading Time)
This is the core time window during which the indicator:
• updates Point A;
• calculates trigger levels;
• validates PDH/PDL;
• draws AB / AC movement structure;
• generates entry signals.
Outside this window, no new signals or recalculations occur.
⚠ If your broker’s first candle opens at a non-standard time (e.g., 00:08), adjust the OTT start time to avoid visual artifacts.
1.6 Show Line A – Displays the opening price level (Point A) until the end of the OTT window.
Style, width, and color are customizable.
1.7 Show Line AB — Price Movement Toward PDH.
Static Method – Single line: A → PDH
Dynamic Method – Two segments:
• A → Daily Low;
• Daily Low → PDH.
If PDH is swept, the “B” label switches to Sweep PDH.
1.8 Show Line AC – Price Movement Toward PDL.
Static Method – Single line: A → PDL
Dynamic Method – Two segments:
• A → Daily High;
• Daily High → PDL.
If PDL is swept, the “C” label switches to Sweep PDL.
1.9 Show Trigger Up Line (LONG Trigger) – Defines the level where the Long signal can activate.
By default, at 50% of the A → PDH movement.
When price touches this line, the script may:
• show a LONG label;
• trigger an alert.
All visual parameters are customizable.
1.10 Show Trigger Up Line (LONG Trigger)
Same logic as Trigger Up, but based on A → PDL.
1.11 Show Main Zone (OTT Zone) – Visual background highlighting of the active OTT window.
Helps instantly see:
• whether signals are allowed;
• how much time remains in the trading window?
Color and opacity are adjustable.
1.12 Upper Zone (toward PDH) – Tracks the protected area towards PDH.
Updates dynamically with new highs.
1.13 Lower Zone (toward PDL) – Tracks the zone toward PDL.
Updates dynamically with new lows.
1.14 Show Labels – Displays reference labels (A, B, C, Trigger Up, Trigger Down).
Label size is customizable.
1.15 Add Price – Adds the exact price value to each label.
1.16 Change Color after Sweep PDH or PDL – After PDH or PDL is broken, the indicator automatically recolors lines and labels to visually confirm the sweep.
1.17 Show SHORT Label – Displays the SHORT entry label when all conditions for a bearish signal are met.
Style parameters are set in the previous blocks.
1.18 Alert on Bearish Trigger Down – Triggers an alert when the price activates the bearish trigger.
1.19 Show LONG Label – Displays the LONG entry label when bullish conditions are met.
Style parameters are set in the previous blocks.
1.20 Alert on Bullish Trigger Up – Triggers an alert when the price activates the bullish trigger.
1.21 Alerts Active Time – Defines a custom time interval during which trigger signals are allowed.
Even if price touches a trigger level,
❗ signals will NOT be generated outside this allowed time.
Useful for:
• avoiding Asian session signals;
• reducing noise in low-liquidity periods.
1.22 Labels and Alerts Display Mode
Two settings modes:
• On Trigger (Instant Mode) – Signals appear immediately when price touches the trigger.
• On Candle Close (Conservative Mode) – Signals form only after the candle closes beyond the trigger level.
A more conservative option.
1.23 Delay LHD Signal Until MA Ribbon Confirms Direction – If enabled, LHD signals will NOT fire until the MA Ribbon produces a matching directional signal.
Logic:
• Price hits the trigger → LHD conditions become “armed”;
• The indicator waits;
• When MA Ribbon confirms trend direction (Long/Short);
• The final LHD label + alert is generated.
This ensures LHD trades are filtered and aligned with MA-based trend confirmation.
⚠ Works only when the MA Ribbon module is active.

Liquidity Sweeps 2.0 – MGTrading Professional Liquidity Sweep Engine with Volume, MACD, Trend, SMT Divergence & Rolling VWAP
Liquidity Sweeps 2.0 is a **complete precision-based liquidity detection framework** built for traders who follow smart money concepts, sweep-based entries, and algorithmic price behavior.
This tool detects **high-probability buy/sell sweeps**, confirms them with market structure, Volume, MACD engine, Trend filtering, SMT divergence, and overlays a Rolling VWAP to track accumulation & distribution behavior.
It is designed for futures, indices, forex, crypto, and options traders.
-
🔥 **MAIN FEATURES**
✅ **1. True Liquidity Sweep Detection**
Automatically detects when price:
* Sweeps a prior high (Sell Sweep)
* Sweeps a prior low (Buy Sweep)
* Rejects and closes back inside the previous range
This helps identify real **stop hunts**, **liquidity grabs**, and **reversal moments**.
---
✅ **2. Volume Spike Confirmation (Smart Filter) **
Sweeps are only confirmed when volume exceeds the dynamic SMA threshold.
This filters out weak sweeps and keeps only **high-quality liquidity grabs**.
✅ **3. MACD Engine Confirmation**
Advanced MACD rules confirm sweeps by:
* MACD direction
* MACD signal agreement
* MACD histogram alignment
This dramatically increases accuracy and removes fake sweeps that occur in weak trends.
Optional **MACD Divergence Detection** reveals trend exhaustion before major reversals.
✅ **4. EMA Trend Filter (9/21) **
Avoid fighting the trend with the optional trend filter:
* Only buy sweeps in uptrend
* Only sell sweeps in downtrend
Great for scalpers and day traders who want trend alignment.
✅ **5. SMT Divergence (Relative Strength vs Reference Symbol) **
Enable SMT to detect when:
* Your chart sweeps a high/low
* But the reference symbol DOES NOT
This creates **displacement**, a powerful reversal signal used by institutional traders.
The symbol is selectable (ES, NQ, SPY, QQQ, BTC.D, DXY, etc.).
✅ **6. Rolling VWAP (RVWAP)**
A more dynamic version of VWAP using:
* Time-based rolling windows
* Volume-weighted price
* Automatic or adjustable window size
* Color change based on slope
Excellent for tracking **accumulation**, **distribution**, and **algorithmic trend bias**.
✅ **7. Clean Mode**
Only show “confirmed” sweeps with a ✓
Ideal for traders who want a simple and clean chart.
# 📊 **LABELS & COLOR CODING**
* 🟥 **Sweep Sell**
* 🟩 **Sweep Buy**
* 🟧 **MACD Bearish Divergence**
* 🟩 **MACD Bullish Divergence**
* 🟦/🟧 **RVWAP Up/Down Trend**
* “✓” means the sweep passed all confirmations.
# 🎯 **WHO IS THIS FOR?**
✔ Futures Traders (ES, NQ, YM, RTY, CL, GC)
✔ Options Traders (SPX, SPY, QQQ)
✔ Forex Traders
✔ Crypto Traders
✔ Smart Money / ICT Style Traders
✔ Liquidity Sweep Traders
✔ Scalpers, Day Traders, Swing Traders
If you trade **liquidity**, **sweeps**, **SMT**, **divergence**, or **VWAP-based behavior**, this indicator is designed for you.
# 🧠 **HOW TO USE IT**
1. Wait for a sweep label to appear at a liquidity pool.
2. Confirm with volume + MACD + trend (if enabled).
3. Watch RVWAP for bias (accumulation vs distribution).
4. Enter on the imbalance/FVG, retrace, or structure break.
5. Use SMT divergence as a premium confirmation.
This tool does NOT repaint after the bar closes.
Signals only appear when conditions are confirmed.
# 📦 **SETTINGS OVERVIEW**
* Lookback window for sweeps: (7 - 13)
* Volume spike threshold
* MACD lengths & filters
* Trend filter (EMA 9/21)
* SMT reference symbol
* RVWAP window + colors
RVWAP Line Width: (2) & Minimum Window Bars: (5)
* Label placement & visual adjustments
* Clean mode
Everything is fully customizable.
⚠️ **DISCLAIMER**
This indicator is for educational purposes only.
It does not guarantee profits.
Always backtest, practice proper risk management, and trade responsibly.
❤️ **If this helped you, leave a like & comment! **
Your support motivates further updates, improvements, and new tools.

Price-Volume Correlation Strength (PVC)Overview
The Price-Volume Correlation Strength (PVC) indicator is a behavioral-analysis tool that quantifies the relationship between price movement and volume participation to distinguish t rue directional moves from false momentum or exhaustion traps .
It combines dynamic price–volume correlation logic, signal clustering, liquidity-sweep detection, and multi-day reference levels into a single, data-driven framework that adapts across all markets and timeframes.
⸻
1️⃣ Core Logic — Price vs Volume Correlation
At the heart of PVC is the belief that price without volume confirmation is deception .
The script evaluates whether volume supports or contradicts price direction using a rolling volume average and short-term price delta:
Price Direction Volume Behavior
↑ Price + ↑ Volume True Bull Move ✅ — Healthy rally with strong participation
↑ Price + ↓ Volume False Bull Move ⚠️ — Buyer exhaustion or fake breakout
↓ Price + ↑ Volume True Bear Move ✅ — Active selling pressure
↓ Price + ↓ Volume False Bear Move ⚠️ — Short covering / weak decline
Candles are automatically color-coded so that traders can instantly identify whether the current move is being supported (lime/red) or rejected (gray) by the underlying volume dynamics.
2️⃣ Signal Module — Trend Confirmation & Reversal
PVC tracks sequences of consecutive “true” bars to generate BUY or SELL signals once momentum aligns with sustained volume confirmation.
A built-in signal-strength filter (user-adjustable) ensures that only moves with multi-bar confirmation are considered.
Signals are non-repainting: once triggered, they persist until an opposite direction is confirmed.
3️⃣ Liquidity Sweep Engine
Markets often manipulate recent highs/lows to trigger stops before true reversals begin.
The Liquidity Sweep Engine detects these events by comparing current highs/lows to prior extremes and validating them with above-average volume bursts .
• Bullish Sweep (Blue dot below bar): liquidity taken below prior lows, buyers absorb volume → potential reversal up.
• Bearish Sweep (Blue dot above bar): liquidity taken above prior highs, sellers absorb volume → potential reversal down.
This module helps traders recognize Smart Money traps and stop-hunt zones that precede major turning points.
4️⃣ Adaptive Dashboard
A compact, on-chart dashboard summarizes the market state in real time:
• Price Direction — UP / DOWN / FLAT
• Volume Trend — RISING / FALLING
• Move Validity — True / False Move
• Signal Status — Active Buy / Sell / Mixed
• Recent Sweeps — Bull / Bear / Both / None
Border and grid colors are user-configurable for visual clarity.
⸻
5️⃣ Multi-Day OHLC & VWAP Suite
To complement the intraday correlation engine, PVC integrates a Multi-Day OHLC module that automatically projects up to 10 previous-day levels (High, Low, Close, and VWAP).
These act as natural liquidity magnets and reaction zones where price often pauses or reverses.
Users can customize:
• Line colors for each level type
• Universal or per-type line thickness
• Number of days to display (1–10)
This turns the indicator into a complete context map—linking current price–volume behavior with historical reference levels.
⸻
6️⃣ Alerts & Practical Use
Built-in alerts trigger on:
• True Bull Move / True Bear Move (momentum confirmation)
• Buy / Sell Signals (multi-bar strength filter)
• Bullish / Bearish Liquidity Sweep (stop-hunt detection)
Best use cases
• Identify whether a breakout is real or fading before entering.
• Confirm reversals with simultaneous volume confirmation + liquidity flush.
• Combine with VWAP or structure tools to align with institutional footprints.
⸻
7️⃣ Why PVC is Original
While most volume indicators only show totals or ratios, PVC focuses on behavioral correlation—the timing and agreement between price change and participation.
By merging price–volume validation, trap detection, and multi-day liquidity mapping inside one unified system, PVC provides a contextual narrative of market strength that no single classic indicator offers.
⸻
How to Use
1. Apply on any timeframe or instrument.
2. Observe candle colors for confirmation or divergence.
3. Watch the dashboard: when both Price UP + Volume Rising + True Move + Buy Active, the move has strong backing.
4. If “False Move” or “Liquidity Sweep” appears, expect a possible reversal.
5. Align entries with daily VWAP/High/Low zones for confluence.
⸻
⚠️ Disclaimer
This script is for educational and analytical purposes.
It does not constitute financial advice or a guaranteed signal system.
Always confirm with your broader trading strategy and risk management.
⸻

TopBot [CHE] TopBot — Structure pivots with buffered acceptance and gradient trend visualization
Summary
TopBot detects swing structure from confirmed pivot highs and lows, derives support and resistance levels, and switches trend only after a buffered and accepted break. It renders labels for recent structure points, maintains dynamic support and resistance lines that freeze on contact, and colors candles using a gradient that reflects consecutive trend persistence. The gradient communicates strength without extra panels, while the buffered acceptance reduces fragile flips around key levels. Everything runs in the main chart for immediate context.
Motivation: Why this design?
Classical swing tools often flip on single-bar spikes and produce lines that extend forever without acknowledging when price invalidates them. This script addresses that by requiring a user-controlled buffer and a run of consecutive closes before changing trend, while also freezing lines once price interacts with them. The gradient color layer communicates regime persistence so users can quickly judge whether a move is maturing or just starting.
What’s different vs. standard approaches?
Baseline reference: Simple pivot labeling and unbuffered break-of-structure tools.
Architecture differences:
Buffered level testing using ticks, percent, or ATR.
Acceptance logic that requires multiple consecutive closes.
Synchronized structure labeling with a single Top and Bottom within the active set.
Progressive support and resistance management that freezes lines on first contact.
Gradient candle and wick coloring driven by consecutive trend counts with windowed normalization and gamma control.
Practical effect: Fewer whipsaw flips, clearer status of active levels, and visual feedback about trend persistence without a secondary pane.
How it works (technical)
The script confirms swing points using left and right bar pivots, then forms a current structure window to classify each pivot as higher high, lower high, higher low, or lower low. Recent labels are trimmed to a user cap, and a postprocess step ensures one highest and one lowest label while preserving side information for the others. Support updates on higher low events, resistance on lower high events. Trend flips only after the close has moved beyond the active level by a chosen buffer and this condition holds for a chosen number of consecutive bars. Lines for new levels extend to the right and freeze once price touches them. A running count of consecutive trend bars produces a strength score, which is normalized over a rolling window, shaped by gamma, and mapped to user-defined dark and neon colors for both up and down regimes. Wick coloring uses `plotcandle`; fallback bar coloring uses `barcolor`. No higher-timeframe data is requested. Signals confirm only after the right-bar lookback of the pivot function.
Parameter Guide
Left Bars / Right Bars (default five each): Pivot sensitivity. Larger values confirm later and reduce noise; smaller values respond faster with more noise.
Draw S/R Lines (default true): Enables support and resistance line creation and updates.
Support / Resistance Colors (lime, red): Line colors for each side.
Line Style (Solid, Dashed, Dotted; default Dotted) and Width (default three): Visual style of S/R lines.
Max Labels & Lines (default ten): Cap for objects to control clutter and resource usage.
Change Bar Color (default true), Up/Down colors (blue, black): Fallback bar coloring when gradients or wick coloring are disabled.
Show Neutral Candles (default false): Optional coloring when no trend is active.
Enable Gradient Bar Colors (default true): Turns on gradient body coloring from the strength score.
Enable Wick Coloring (default true): Colors wicks and borders using `plotcandle`.
Collection Period (default one hundred): Rolling window used to scale the strength score. Shorter windows react faster but vary more.
Gamma Bars / Gamma Plots (defaults zero point seven and zero point eight): Shapes perceived contrast of bar and wick gradients. Lower values brighten early; higher values compress until stronger runs appear.
Gradient Transparency / Wick Transparency (default zero): Visual transparency for bodies and wicks.
Up/Down Trend Dark and Neon Colors: Endpoints for gradient mapping in each regime.
Acceptance closes (n) (default two): Number of consecutive closes beyond a level required before trend flips. Larger values reduce false breaks but react later.
Break buffer (None, Ticks, Percent, ATR; default ATR) and Value (default zero point five) and ATR Len (default fourteen): Defines the safety margin beyond the level. ATR mode adapts to volatility; Percent and Ticks are static.
Reading & Interpretation
Labels: “Top” and “Bottom” mark the most extreme points in the active set; “LT” and “HB” indicate side labels for lower top and higher bottom.
Lines: New support or resistance is drawn when structure confirms. A line freezes once price touches it, signaling that the dynamic phase ended.
Trend: Internal state switches to up or down only after buffered acceptance.
Colors: Brighter neon tones indicate stronger and more persistent runs; darker tones suggest early or weakening runs. When gradients are off, fallback bar colors indicate trend sign.
Practical Workflows & Combinations
Trend following: Wait for a buffered and accepted break through the most recent level, then use gradient intensity to stage entries or scale-ins.
Structure-first filtering: Trade only in the direction of the last accepted trend while price remains above support or below resistance.
Exits and stops: Consider exiting on loss of gradient intensity combined with a return through the most recent structure level.
Multi-asset / Multi-timeframe: Works on liquid symbols across common timeframes. Use larger pivot bars and higher acceptance on lower timeframes. No built-in higher-timeframe aggregation is used.
Behavior, Constraints & Performance
Repaint/confirmation: Pivot confirmation waits for the right bar window; trend acceptance is based on closes and can change during a live bar. Final signals stabilize on bar close.
security/HTF: Not used. No cross-timeframe data.
Resources: Arrays and loops are used for labels, lines, and structure search up to a capped historical span. Object counts are clamped by user input and platform limits.
Known limits: Delayed confirmation at sharp turns due to pivot windows; rapid gaps can jump over buffers; gradient scaling depends on the chosen collection period.
Sensible Defaults & Quick Tuning
Start with the defaults: pivot windows at five, ATR buffer with value near one half, acceptance at two, collection period near one hundred, gamma near zero point seven to zero point eight.
Too many flips: increase acceptance, increase buffer value, or increase pivot windows.
Too sluggish: reduce acceptance, reduce buffer value, or reduce pivot windows.
Colors too flat: lower gamma or shorten the collection period.
Visual clutter: reduce the max labels and lines cap or disable wicks.
What this indicator is—and isn’t
This is a visualization and signal layer that encodes swing structure, level state, and regime persistence. It is not a complete trading system, not predictive, and does not manage orders. Use it with broader context such as higher timeframe structure, session behavior, and defined risk controls.
Disclaimer
The content provided, including all code and materials, is strictly for educational and informational purposes only. It is not intended as, and should not be interpreted as, financial advice, a recommendation to buy or sell any financial instrument, or an offer of any financial product or service. All strategies, tools, and examples discussed are provided for illustrative purposes to demonstrate coding techniques and the functionality of Pine Script within a trading context.
Any results from strategies or tools provided are hypothetical, and past performance is not indicative of future results. Trading and investing involve high risk, including the potential loss of principal, and may not be suitable for all individuals. Before making any trading decisions, please consult with a qualified financial professional to understand the risks involved.
By using this script, you acknowledge and agree that any trading decisions are made solely at your discretion and risk.
Do not use this indicator on Heikin-Ashi, Renko, Kagi, Point-and-Figure, or Range charts, as these chart types can produce unrealistic results for signal markers and alerts.
Best regards and happy trading
Chervolino
Acknowledgment
Thanks to LonesomeTheBlue for the fantastic and inspiring "Higher High Lower Low Strategy" .
Original script:
Credit for the original concept and implementation goes to the author; any adaptations or errors here are mine.

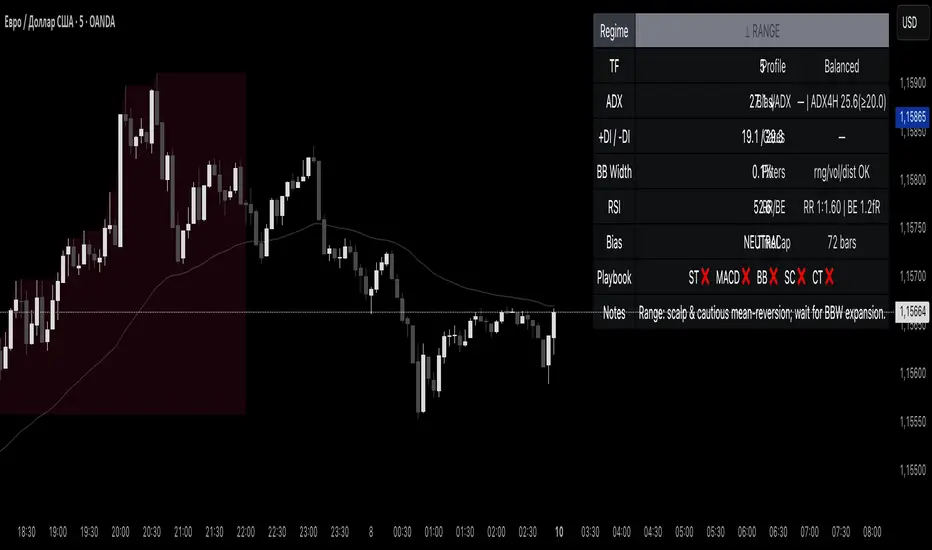
Reddington Regime Panel + PlaybookReddington Regime Panel + Playbook
On-chart market regime panel and strategy playbook for use with ReddingtonBotAdaptive Signal.
Shows the current regime (Trend / Correction / Range), key metrics (TF, ADX, +DI/−DI, BB Width, RSI), directional bias, and a Playbook with live recommendations for the ReddingtonBotAdaptive Signal strategies ST / MACD / BB / SC / CT:
✅ Use
⚠ Use with caution / extra condition
❌ Avoid
This script is a context filter. Pair it with ReddingtonBotAdaptive Signal to decide when its entries are most appropriate.
What it does
Classifies the market on your chosen timeframe into:
TREND UP / TREND DOWN / CORRECTION UP / CORRECTION DOWN / RANGE.
Guides strategy selection for ReddingtonBotAdaptive Signal via a compact on-chart table.
Multi-timeframe & multi-asset: works on any symbol and exchange; calculations are performed on the selected timeframe via request.security.
Clean UI: table only (top-right). No lines, no shapes, no price-scale impact.
How it works (logic)
Uses standard, transparent components:
EMA(20) / EMA(34) — directional structure and mean.
DMI/ADX(14) — trend strength and side dominance (+DI vs −DI).
Bollinger Band Width(20) — volatility compression/expansion.
ATR(14) — normalizes EMA “confluence/flatness”.
RSI(14) — “healthy pullback” bands in corrections.
Regime definitions (summary):
TREND UP/DOWN — ADX ≥ trend threshold, +DI/−DI confirm direction, EMA20/34 aligned, not in heavy squeeze.
CORRECTION UP/DOWN — price between EMA20 and EMA34 within a trend, ADX between range/trend thresholds, RSI in pullback band.
RANGE — ADX ≤ range threshold and/or EMAs “confluent” (flat) with low BB Width.
Playbook mapping for ReddingtonBotAdaptive Signal
The panel renders a line like: ST ✅ MACD ✅ BB ⚠ SC ✅ CT ❌
TREND UP / TREND DOWN
ST ✅, MACD ✅, SC ✅, BB ⚠, CT ❌
Trade with trend. For BB, prefer confirmed expansion (BB Width ↑ & ADX ↑).
CORRECTION UP / CORRECTION DOWN
ST ✅, SC ✅, MACD ⚠, BB ⚠, CT ❌
Wait for impulse resumption (ADX uptick / BBW expansion) after EMA20/VWAP retest.
RANGE
SC ✅, CT ⚠, ST ❌, MACD ❌, BB ❌/⚠
Mean-reversion/scalps inside the corridor; BB only if early expansion emerges.
✅/⚠/❌ are heuristics. Tune thresholds per asset/timeframe if needed.
Inputs (essentials)
Regime timeframe — empty = use chart TF.
ADX Trend/Range Thresholds — default 25 / 20.
EMA Fast/Slow — 20 / 34.
BB Width Length — 20.
ATR Length — 14.
EMA confluence vs ATR (×ATR) — flatness sensitivity (default 0.20).
BBW squeeze factor (vs BBW SMA) — compression sensitivity (default 0.90).
Correction RSI bands — pullback zones for up/down trends.
Show Playbook — toggle recommendations row.
How to use with ReddingtonBotAdaptive Signal
Filter first, then act: take Adaptive entries only when the Playbook shows ✅ for that strategy in the current regime.
Confirm at bar close on the regime timeframe to avoid MTF “in-bar” fluctuations.
Best practice:
Trading TF: 5–15m
Regime filter TF: 15m–1h
Raise ADX Trend to 28–30 on noisy assets; set BBW squeeze to 1.0 on volatile alts.
Notes & limitations
This is an analytical tool, not an entry/exit system.
No alerts by design (panel only). You can add alerts in your entry script.
MTF values update until the higher-TF bar closes; for strict discipline, use confirmed bars.
Disclaimer
This script is for educational purposes only and is not financial advice. Trading involves risk, including the loss of capital. Past performance does not guarantee future results. By using this script, you acknowledge that you are solely responsible for your trading decisions.
Transactional Rate of Change (TROC)TRANSACTIONAL RATE OF CHANGE (TROC) INDICATOR
Transaction Rate of Change (TROC) is an advanced momentum indicator that analyzes the rate of change in cumulative inferred buy/sell volume data to identify shifts in buying and selling acceleration and deceleration of transaction flow, providing early signals of potential trend changes, exhaustion/absorption, and momentum shifts. It builds further upon the official Volume Delta indicator released by TradingView.
If a stock price is a rocket climbing , then volume delta is the total fuel burned, and TROC is the fuel burn rate . A rocket can keep rising even after engines start throttling down (decelerating TROC), but it won't go much higher without more thrust. When TROC shows extreme positive readings, the engines are at maximum burn—expect explosive price movement. When TROC drops to zero while price is still high, the fuel is depleted and gravity (selling pressure) takes over. Are buyers pushing on the gas, or are they backing off? Are more buyers coming to the table, or are they losing interest or taking profits? Are excited retail buying highs while smart money close their positions using the excited retail liquidity?
KEY FEATURES
• Volume Delta Analysis - Approximates up and down volume from lower timeframe data to calculate true buying vs. selling pressure.
• Rate of Change Calculation - Measures the momentum of cumulative delta over a customizable period. Essentially, it displays the rate of change between buying and selling. How fast is it going, is it slowing, how excited are they?
• Momentum State Detection - Automatically identifies four distinct market states: accelerating up, decelerating up, accelerating down, and decelerating down
• Extreme Threshold Zones - Bands based on standard deviation to highlight unusually high or low transaction rates, helping to spot potential extreme values, blow offs, and capitulation.
• Z-Score Normalization - Optional standardization for comparing momentum across different timeframes and instruments.
• Momentum Strength Index (MSI) - Filters out weak signals by highlighting only bars with momentum exceeding a threshold.
• Flexible Reset Modes - Reset cumulative delta daily, weekly, monthly, or per session to prevent data drift, or leave it default for continual cumulative data.
APPLICATION
Trend Confirmation
When price makes a new high but TROC is decelerating (lighter colors), it suggests weakening buying pressure and potential exhaustion. Conversely, strong acceleration (darker colors) confirms robust trend continuation. Either buyers are supporting the move, or they aren't. Same goes for selling. It can also assist spotting short covering.
Divergence Trading
Use it similar to MACD divergence strategies. Is price movement confirmed by expansion in TROC, or is the TROC showing weakness while price is continuing it's trend?
Momentum Breakouts
When TROC crosses above the upper threshold zone with strong momentum (MSI activated), it signals institutional-level buying that often precedes significant price moves. Use this for breakout entries.
Mean Reversion
Extreme readings beyond the threshold zones often precede short-term reversals as transaction rates normalize. Consider taking profits or counter-trend positions when TROC reaches statistical extremes. Utilizing the extreme threshold bands can help you identify tops and bottoms.
Absorption Detection
Spot areas where buying or selling is being done, but price is hitting a wall or floor and not moving. This can indicate a hidden seller or a buyer reloading at price levels/zones.
SETTINGS
Timeframe for Volume Delta Calculation
Select the lower timeframe used to calculate buying and selling volume. Default: 1S (1 second)
• 1S or 5S - Maximum precision for scalping and intraday trading on liquid markets
• 1m or 5m - Balanced precision for swing trading and less liquid instruments
• Higher timeframes - Provide more historical data but reduce accuracy
Note: Higher frequency data yields more accurate delta calculations but may not be available for all symbols or historical periods. If you are using higher timeframes (Daily, Weekly) you will need to change this setting to a higher timeframe.
Rate of Change Period
Determines how many bars back to measure the momentum change. Default: 14
• Short periods (7-10) - More responsive, ideal for scalping and quick momentum shifts
• Medium periods (14-20) - Balanced sensitivity for day trading
• Long periods (25-50) - Smoother readings for swing trading and trend analysis
Shorter periods generate more signals but increase false positives; longer periods reduce noise but may lag significant changes.
Extreme Threshold Zones
Bands that highlight unusual transaction rate extremes based on standard deviation.
• Show Zones - Enable/disable the upper and lower threshold lines (Default: Enabled)
• Multiplier - Standard deviation multiplier for zone placement (Default: 2.0)
Values of 1.5-2.0 catch moderate extremes
Values of 2.5-3.0 identify only the most extreme readings
• Lookback Period - Number of bars used to calculate mean and standard deviation (Default: 100)
Shorter lookback (50-75) adapts faster to changing market conditions
Longer lookback (150-200) provides more stable, consistent zones
Smooth Cumulative Delta
Applies Adaptive Moving Average to reduce noise in the cumulative volume delta before calculating rate of change. Default: Enabled
• Smoothing Length - period (Default: 5)
Lower values (3-5) preserve responsiveness
Higher values (7-10) significantly reduce noise on choppy markets
Smoothing is particularly useful on volatile instruments or when using very short ROC periods.
Momentum Strength Index (MSI)
Filters the histogram to highlight only bars exceeding a specified momentum threshold, eliminating weak signals.
• Show MSI - Enable/disable momentum strength filtering (Default: Disabled)
• MSI Threshold - Minimum momentum strength multiplier (Default: 2.0)
Values of 1.5-2.0 show above-average momentum
Values of 2.5-3.5 isolate only exceptional momentum bars
When enabled, bars meeting the threshold display in the "Strong Up/Down" colors, while normal bars use standard momentum colors.
Display Settings
• Histogram Bar Width - Visual thickness of the columns (Default: 1, Range: 1-10)
• Use Z-Score Normalization - Standardizes TROC values for cross-asset comparison (Default: Disabled)
Enable when comparing multiple instruments or timeframes simultaneously
Z-Score converts values to standard deviations from the mean
• Z-Score Threshold - When using Z-Score Normalization mode, sets the extreme zone levels (Default: 2.0)
Represents standard deviations from mean (2.0 = ~95% confidence interval)
Cumulative Transaction Reset
Determines when the cumulative volume delta resets to zero, preventing infinite accumulation. Default: None
• None - Cumulative delta never resets (continues from symbol history start)
• Daily - Resets at the start of each new trading day
• Weekly - Resets at the start of each week
• Monthly - Resets at the start of each month
• On session change - Resets when market opens (useful for 24-hour markets)
Reset modes prevent cumulative drift that can distort ROC calculations over extended periods.
Color Customization Fully customizable color scheme.
-------------------------------------------------------------------
Note: This indicator requires volume data from your data vendor. It uses inferred buy/sell volume. To learn more, read the TradingView Volume Delta documentation. Optimal performance is achieved on liquid instruments with high-frequency data.

Market Structure Pivots TrendThis indicator identifies and visualizes key market structure by plotting confirmed, non-repainting pivot points. It goes beyond simple markers by classifying the pivots, extending dynamic support/resistance lines, and providing a visual representation of the current trend state.
Key Features:
Non-Repainting Pivot Detection:
Uses a standard lookback method (left and right bars) to identify historical pivot points.
Note on Confirmation: Pivots are only confirmed after the Pivot Right Bars input has passed. This is essential for ensuring the signal is non-repainting, but it introduces an inherent lag.
Automatically classifies the sequence of pivots according to Dow Theory: Higher Highs (HH), Higher Lows (HL), Lower Highs (LH), and Lower Lows (LL).
Pivot Classification Filter:
Price Tolerance Filter: A user-defined percentage tolerance filters out insignificant market noise. A pivot is only classified as 'Higher' or 'Lower' if its price exceeds the previous one by more than the set tolerance, leading to more robust signals.
Equal Pivot Detection: The tolerance also enables the detection of Equal Highs (EH) and Equal Lows (EL), highlighting consolidation zones.
Dynamic Support & Resistance Lines:
When enabled, the indicator extends a horizontal line from the most recent confirmed pivot high and low.
These lines update in real-time, providing clear S/R levels.
Lines automatically terminate if the price decisively breaks through them or if a new pivot of the same type is formed.
Trend State Visualization:
A built-in state machine analyzes the sequence of pivots and breaks to determine the current market trend (Uptrend, Downtrend, or Neutral).
Plots a dynamic step-line based on recent highs/lows to visually represent the current trend state.
Full Customization & Alerts:
Display Options: Choose between simple triangles or detailed text labels that show the pivot type, price, and the absolute or relative change from the previous pivot of the same type.
Visual Styling: Full control over colors for all six pivot types (HH, LH, EH, LL, HL, EL) and line styles.
Comprehensive Alerts: Set up alerts for every new pivot formation (e.g., HH, LL), for S/R line breaks, and for changes in the overall trend state (Up, Down, Neutral).
DISCLAIMER
For Informational/Educational Use Only: This indicator is provided for informational and educational purposes only. It does not constitute financial, investment, or trading advice, nor is it a recommendation to buy or sell any asset.
Use at Your Own Risk: All trading decisions you make based on the information or signals generated by this indicator are made solely at your own risk.
No Guarantee of Performance: Past performance is not an indicator of future results. The author makes no guarantee regarding the accuracy of the signals or future profitability.
No Liability: The author shall not be held liable for any financial losses or damages incurred directly or indirectly from the use of this indicator.
Signals Are Not Recommendations: The alerts and visual signals (e.g., crossovers) generated by this tool are not direct recommendations to buy or sell. They are technical observations for your own analysis and consideration.

CandelaCharts - Oscillator Concepts 📝 Overview
Oscillator Concepts shows a single, easy‑to‑read line on a scale from −1 to +1 . Near 0 means balance; beyond +1 or −1 means the move is stretched. You can add helpful layers like trend stripes, participation shading, volatility markers, calendar dividers, divergence tags, and simple signal markers. Pick a trading profile (Scalping / Day Trade / Swing / Investment) and the lengths update for you.
📦 Features
A quick tour of the visual layers you can enable. Use this to decide which parts to turn on for reading momentum, extremes, trend bias, participation, and volatility at a glance.
The Line (−1…+1) : A clean momentum read with an optional EMA smooth and clear 0 / ±1 guides.
OS/OB Visualization : Soft gradient fills when price action pushes outside ±1; optional background shading for quick scanning.
Trend Radar : Thin stripes just outside the band that show up‑ or down‑bias using a fast‑vs‑slow EMA spread with anti‑flicker logic.
Participation : Shading that reflects who’s pushing — by MFI, classic up/down volume, delta volume, or a combo model that rewards agreement.
Velocity Pulse : Tiny symbols that only appear when volatility is elevated (outside a neutral 40–60 zone).
Fractal Map : Subtle dashed dividers at Daily / Weekly / Monthly / Yearly / 5‑Year boundaries (Auto picks a sensible cadence).
Divergences : Regular bullish/bearish tags at pivots, with an optional high‑probability filter.
Unified Signals : One common vertical level for triangles (OS/OB re‑entries) and divergence icons so your eye doesn’t hunt.
Profiles : Four presets tune all lookbacks together so the tool stays consistent across timeframes.
Themes : Multiple palettes or fully custom bear/mid/bull colors.
Alerts : Ready for “Any alert() function call” with OS/OB and Divergence options.
⚙️ Settings
Every adjustable input in plain English. Set your profile, show or hide reference levels, pick a theme, and toggle components so the visuals match your style and timeframe.
Trading Profile : Scalping / Day Trade / Swing / Investment — automatically adjusts core lengths.
−1…+1 Levels : Show reference lines at ±1.
Smoothing & Length : EMA smoothing for The Line.
OS/OB Zones & Show Fill : Optional background shade plus gentle gradient fills beyond ±1.
Theme : Presets (Default, Blue–Orange, Green–Red, Teal–Fuchsia, Aqua–Purple, Black–Green, Black–White) or Custom .
Divergences : Turn on detection at pivot highs/lows. Length sets left/right bars. HP filter asks that at least one oscillator anchor sits outside ±1.
Participation : Choose MFI , Volume , Delta Volume , or MFI + Vol + Delta . Set the window; optionally smooth it.
Trend Radar : Up or down stripes just beyond ±1 based on a fast/slow EMA spread. Tune Fast and Slow .
Velocity Pulse : Symbols appear only when volatility exits the 40–60 zone; use Fast / Slow to adjust sensitivity.
Fractal Map : Vertical dividers at time boundaries. Auto selects per timeframe, or pick Daily / Weekly / Monthly / Yearly / 5 Years .
Signals : Show All , only OS/OB , or only Divergence markers (shared height for quick scanning).
Alerts - OS/OB Conditions : Fire when The Line enters extremes (crosses above +1 or below −1).
Alerts - OS/OB Signals : Fire when The Line re‑enters the band (comes back inside from > +1 or < −1).
Alerts - Divergence Conditions : Raw regular divergences right when the pivot forms (no HP filter).
Alerts - Divergence Signals : Confirmed regular divergences that pass the HP filter.
⚡️ Showcase
A visual gallery of the indicator's components. Each image highlights one layer at a time—The Line, OS/OB fills, Trend Radar, Participation, Velocity Pulse, Fractal Map, Divergences, and Signals—so you can quickly recognize how each looks on a live chart.
The Line
Participation
Trend Radar
Velocity Pulse
Fractal Map
Divergences
Signals
Overbought/Oversold
📒 Usage
Hands‑on guidance for reading the line, thresholds, and add‑ons in live markets. Learn when to favor continuation vs. mean‑reversion, how to weigh participation and volatility, and where to set invalidation and targets.
Scale : 0 = balance. ±1 = adaptive extremes. A push beyond ±1 isn’t an automatic fade — check trend stripes, participation, and volatility.
Trend vs Mean‑Revert : With bull stripes, favor pullback buys on OS re‑entries; with bear stripes, favor fades on OB re‑entries.
Participation : Strong positive shading supports continuation; weak/negative during new highs is a caution flag.
Volatility Pulse : Symbols only appear when energy is high. In trends they often mark expansion; counter‑trend they can precede snap‑backs.
Divergences : Raw is early; HP is selective. Treat HP as higher‑quality context, not a stand‑alone signal.
Risk : Use nearby structure (swing points, session highs/lows, or a fractal divider) for invalidation. Scale targets around 0 / ±1 and current vol.
Profiles : If entries feel late/early, try a different profile before hand‑tuning every length.
🚨 Alerts
What you can be notified about and how to turn it on. Covers entering extremes, re‑entries from extremes, and divergence detections, with a recommended schedule (once per bar close).
OS/OB Condition — Entered Overbought → when The Line moves up through +1.
OS/OB Condition — Entered Oversold → when The Line moves down through −1.
OS/OB Signal — Re‑Entry from Overbought/Oversold → when The Line comes back inside from an extreme.
Divergence Condition — Bullish/Bearish (raw) → printed as soon as a regular divergence is detected.
Divergence Signal — Bullish/Bearish (confirmed) → only fires when the high‑probability filter passes.
⚠️ Disclaimer
These tools are exclusively available on the TradingView platform.
Our charting tools are intended solely for informational and educational purposes and should not be regarded as financial, investment, or trading advice. They are not designed to predict market movements or offer specific recommendations. Users should be aware that past performance is not indicative of future results and should not rely on these tools for financial decisions. By using these charting tools, the purchaser agrees that the seller and creator hold no responsibility for any decisions made based on information provided by the tools. The purchaser assumes full responsibility and liability for any actions taken and their consequences, including potential financial losses or investment outcomes that may result from the use of these products.
By purchasing, the customer acknowledges and accepts that neither the seller nor the creator is liable for any undesired outcomes stemming from the development, sale, or use of these products. Additionally, the purchaser agrees to indemnify the seller from any liability. If invited through the Friends and Family Program, the purchaser understands that any provided discount code applies only to the initial purchase of Candela's subscription. The purchaser is responsible for canceling or requesting cancellation of their subscription if they choose not to continue at the full retail price. In the event the purchaser no longer wishes to use the products, they must unsubscribe from the membership service, if applicable.
We do not offer reimbursements, refunds, or chargebacks. Once these Terms are accepted at the time of purchase, no reimbursements, refunds, or chargebacks will be issued under any circumstances.
By continuing to use these charting tools, the user confirms their understanding and acceptance of these Terms as outlined in this disclaimer.

AG Pro Dynamic ChannelsAG Pro Dynamic Channels V2
Discover a new lens through which to view market structure with the AG Pro Dynamic Channels V2. This advanced indicator moves beyond simple trendlines, automatically identifying, classifying, and drawing eight distinct types of support and resistance channels directly on your chart.
Built on a sophisticated pivot-point detection engine, this script intelligently distinguishes between Major and Minor price structures, as well as Internal and External channels. This provides a comprehensive and multi-dimensional map of the market's flow, helping you identify trend continuations, corrections, and potential reversals.
The indicator is complete with a powerful, fully customizable alert system designed to notify you of the two most critical events: channel breakouts and price reactions.
Key Features
Fully Automatic Channels: The script automatically analyzes price action to find pivot highs and lows, using them to construct relevant channels without any manual drawing required.
8-Channel Classification: Gain deep market insight by viewing eight distinct channel types:
Major External (Up/Down)
Major Internal (Up/Down)
Minor External (Up/Down)
Minor Internal (Up/Down)
Advanced Pivot Engine: The core logic classifies pivots into categories like Higher Highs (MHH/mHH), Lower Lows (MLL/mLL), Higher Lows (MHL/mHL), and Lower Highs (MLH/mLH) to determine the precise start and end points for each channel.
Deep Customization: Take full control of your chart's appearance. You can individually toggle the visibility, color, line style (solid, dashed, dotted), and line width for all eight channel types.
Chart Clarity: A "Delete Previous" option is available for each channel type, allowing you to keep your chart clean and focused on only the most current and relevant market structures.
Comprehensive Alert System
Never miss a key price interaction. The AG Pro Dynamic Channels V2 features a robust, built-in alert module.
Dual-Alert Conditions: Get notifications for two distinct events:
Break Alert: Triggers when price confirms a close outside of a channel, signaling a potential breakout.
React Alert: Triggers when price touches or interacts with a channel line before closing back inside, signaling a test or rejection.
16 Unique Alerts: You have full control to enable or disable "Break" and "React" alerts for all 8 channel types individually, giving you 16 unique alert conditions to monitor.
Professional Alert Messages: The embedded alert sender provides detailed messages that include the asset, timeframe, and the specific event, such as "Break Major External Up Channel" or "React Minor Internal Down Channel".
Alert Configuration: Easily set your global Alert Name, Message Frequency (e.g., Once Per Bar, Once Per Bar Close), and Alert Time Zone from the script's settings.
How to Use
Trend Identification: Use the Major External Channels (drawn from MHH and MLL pivots) to identify the primary, long-term trend direction.
Pullback & Entry Zones: Use the Internal Channels (drawn from MHL and MLH pivots) to spot corrections and potential entry zones within an established trend.
Breakout Trading: Set Break Alerts on Major channels to be notified of significant, structure-shifting moves.
Short-Term & Counter-Trend: Utilize the Minor Channels to identify shorter-term price swings and potential reversal points.

Sunmool's NY Lunch Model BacktestingICT NY Lunch Model Backtesting (12:00–13:00 NY) 🗽🍔
This research indicator tests an ICT narrative using the New York lunch window (12:00–13:00 America/New_York). It records that hour’s high/low and measures, during the post-lunch session (default 13:00–16:00), how often:
⬆️ If the afternoon trends up, the Lunch Low gets swept first.
⬇️ If the afternoon trends down, the Lunch High gets swept first.
It reports these as conditional probabilities, not trade signals. 📈
👀 What it shows
🟦 Lunch Range box (toggle): high/low from 12:00–13:00 NY
🔻🔺 Sweep signals (bar-anchored)
Low sweep: triangle below bar + optional “L”
High sweep: triangle above bar + optional “H”
🧱 Optional small box wrapping the swept candle
📊 Stats table (top-right)
P(L-swept | Up) — % of Up-days where Lunch Low was swept
P(H-swept | Down) — % of Down-days where Lunch High was swept
🔁 Contradictions + sample sizes (Up-days / Down-days)
🎯 Direction logic (Up/Down)
Anchor: 13:00 open (pmOpen) ⏰
Threshold: ATR × multiple or % from 13:00
Close ≥ pmOpen + threshold → Up-day
Close ≤ pmOpen − threshold → Down-day
Tiny moves under the threshold are ignored to reduce noise 🧹
⚙️ Inputs
🌐 Timezone: America/New_York (DST handled)
🍽️ Lunch window: 1200–1300
🕓 Post-lunch window: default 1300–1600 (try 17:00/20:00 for sensitivity)
📐 Trend threshold: ATR / Percent (with length/multiple or % level)
📅 Weekdays-only toggle (FX/Equities style)
👁️ Display toggles: Lunch box / sweep arrows / sweep text / sweep candle box / stats table
🔔 TF hint when chart TF > 15m
🧭 How to use
Use 5–15m charts for accurate lunch range capture.
Scroll ~1 year for meaningful samples.
Run sensitivity checks: vary ATR/% thresholds and the post-lunch end time.
For crypto, compare with vs without weekends. 🚀
🧠 Reading the results
High P(L-swept | Up) with a solid Up-day count ⇒ on up afternoons, lunch low is often swept.
High P(H-swept | Down) ⇒ on down afternoons, lunch high is often swept.
Lower Contradictions = cleaner tendency.
Remember: this is a probabilistic tendency, not a rule. 🎲
📝 Notes & limits
All markers (arrows, text, sweep boxes) are bar-anchored; the lunch range box is a research overlay you can toggle.
Real-time vs historical bar building can differ—interpret on bar close. 🔒

cd_correlation_analys_Cxcd_correlation_analys_Cx
General:
This indicator is designed for correlation analysis by classifying stocks (487 in total) and indices (14 in total) traded on Borsa İstanbul (BIST) on a sectoral basis.
Tradingview's sector classifications (20) have been strictly adhered to for sector grouping.
Depending on user preference, the analysis can be performed within sectors, between sectors, or manually (single asset).
Let me express my gratitude to the code author, @fikira, beforehand; you will find the reason for my thanks in the context.
Details:
First, let's briefly mention how this indicator could have been prepared using the classic method before going into details.
Classically, assets could be divided into groups of forty (40), and the analysis could be performed using the built-in function:
ta.correlation(source1, source2, length) → series float.
I chose sectoral classification because I believe there would be a higher probability of assets moving together, rather than using fixed-number classes.
In this case, 21 arrays were formed with the following number of elements:
(3, 11, 21, 60, 29, 20, 12, 3, 31, 5, 10, 11, 6, 48, 73, 62, 16, 19, 13, 34 and indices (14)).
However, you might have noticed that some arrays have more than 40 elements. This is exactly where @Fikira's indicator came to the rescue. When I examined their excellent indicator, I saw that it could process 120 assets in a single operation. (I believe this was the first limit overrun; thanks again.)
It was amazing to see that data for 3 pairs could be called in a single request using a special method.
You can find the details here:
When I adapted it for BIST, I found it sufficient to call data for 2 pairs instead of 3 in a single go. Since asset prices are regular and have 2 decimal places, I used a fixed multiplier of $10^8$ and a fixed decimal count of 2 in Fikira's formulas.
With this method, the (high, low, open, close) values became accessible for each asset.
The summary up to this point is that instead of the ready-made formula + groups of 40, I used variable-sized groups and the method I will detail now.
Correlation/harmony/co-movement between assets provides advantages to market participants. Coherent assets are expected to rise or fall simultaneously.
Therefore, to convert co-movement into a mathematical value, I defined the possible movements of the current candle relative to the previous candle bar over a certain period (user-defined). These are:
Up := high > high and low > low
Down := high < high and low < low
Inside := high <= high and low >= low
Outside := high >= high and low <= low and NOT Inside.
Ignore := high = low = open = close
If both assets performed the same movement, 1 was added to the tracking counter.
If (Up-Up), (Down-Down), (Inside-Inside), or (Outside-Outside), then counter := counter + 1.
If the period length is 100 and the counter is 75, it means there is 75% co-movement.
Corr = counter / period ($75/100$)
Average = ta.sma(Corr, 100) is obtained.
The highest coefficients recorded in the array are presented to the user in a table.
From the user menu options, the user can choose to compare:
• With assets in its own sector
• With assets in the selected sector
• By activating the confirmation box and manually entering a single asset for comparison.
Table display options can be adjusted from the Settings tab.
In the attached examples:
Results for AKBNK stock from the Finance sector compared with GARAN stock from the same sector:
Timeframe: Daily, Period: 50 => Harmony 76% (They performed the same movement in 38 out of 50 bars)
Comment: Opposite movements at swing high and low levels may indicate a change in the direction of the price flow (SMT).
Looking at ASELS from the Electronic Technology sector over the last 30 daily candles, they performed the same movements by 40% with XU100, 73.3% (22/30) with XUTEK (Technology Index), and 86.9% according to the averages.
Comment: It is more appropriate to follow ASELS stock with XUTEK (Technology index) instead of the general index (XU100). Opposite movements at swing high and low levels may indicate a change in the direction of the price flow (SMT).
Again, when ASELS stock is taken on H1 instead of daily, and the length is 100 instead of 30, the harmony rate is seen to be 87%.
Please share your thoughts and criticisms regarding the indicator, which I prepared with a bit of an educational purpose specifically for BIST.
Happy trading.

Up vs Down Volume Compared to PriceHi team,
I’ve put together a simple TradingView indicator that breaks down the last N candles into up-moves and down-moves, showing how much volume supported each side. It helps you quickly see whether the market is rallying on strong participation or just drifting higher on weak volume.
The tool tracks total up-volume versus down-volume, compares their ratios, and flags when pullbacks are happening with noticeably lower volume than the prior push up — a setup that often signals a healthy continuation rather than a reversal.
It also shows key metrics like total volume, price change, and up/down ratios directly on the chart for quick assessment. You’ll instantly know if you’re looking at a light-volume pullback or a heavy-volume sell-off.
Let’s test it out across a few symbols and discuss any tweaks we’d like — maybe layering an EMA or VWAP filter for cleaner trend confirmation.
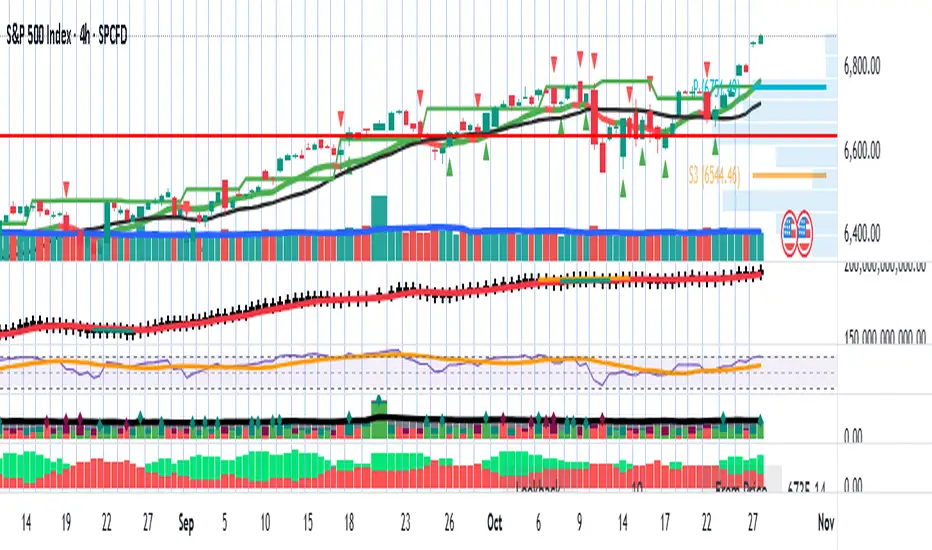
RSI +WMA+ MA + Div SETUPRSI +WMA+ MA + Div SETUP
Индикатор объединяет анализ RSI, скользящих средних RSI (EMA/WMA), дивергенций, автоматические уровни поддержки/сопротивления на RSI, «лестницу цен» для целевых уровней RSI и фильтр тренда со старшего таймфрейма (HTF).
Точки входа формируются строго в месте пересечения RSI с заданным уровнем после выполнения выбранного сетапа. Поддержан режим «без повторов до смены направления».
Что показывает
Линии RSI, EMA(9) от RSI и WMA(45) от RSI.
Фон панели: бычий/медвежий/нейтральный режим импульса RSI (по соотношению EMA и WMA и наклону WMA).
Маркеры ▲/▼ — смена фазы импульса RSI (не торговые сигналы).
Дивергенции (регулярные): Bull/Bear с метками.
Auto SnR на RSI: динамические уровни поддержки/сопротивления по экстремумам RSI.
WMA SnR points: точки ретеста WMA на RSI.
Лестница цен: оценка цены, при которой RSI достигнет выбранных уровней.
HTF-линия: WMA(45) от RSI на старшем ТФ (по желанию).
Торговые сигналы (BUY/SELL)
Сигналы строятся в окне осциллятора RSI ровно в точке кросса:
BUY: (по выбранному сетапу) + пересечение RSI↑ заданного уровня (по умолчанию 40) + (опционально) выполнен HTF-фильтр.
SELL: (по выбранному сетапу) + пересечение RSI↓ заданного уровня (по умолчанию 60) + (опционально) выполнен HTF-фильтр.
Сетапы входа (переключатель)
Setup 1: Div + Cross — требуется подтверждённая дивергенция (Bull/Bear) и кросс RSI уровня в пределах заданного «окна» баров.
Setup 2: Cross only — только кросс RSI уровня, без требования дивергенции.
HTF-фильтр тренда
Расчёт WMA(45) от RSI на настраиваемом HTF (M, H1=60, H4=240, D и т. д.).
Разрешение Лонга, если HTF_WMA45 ≥ L-уровня (например, 50).
Разрешение Шорта, если HTF_WMA45 ≤ S-уровня.
Опция «Только после закрытия HTF-свечи» исключает перерисовку фильтра до закрытия старшего бара.
Основные настройки
RSI Length, Source.
EMA Length / WMA Length (для линий на RSI).
Визуальные уровни RSI (Up/Down) и подсветка фона.
Divergence: пороги показа (RSI ≤ X / ≥ Y), метки.
Price ladder: список целевых уровней RSI и «шаг» вывода цен.
Auto SnR: три окна lookback, цвета линий.
WMA SnR: чувствительность к ретестам WMA.
Entries: выбор сетапа, окно после дивергенции, уровни для Лонга/Шорта (по умолчанию 40/60), «ставить метку по фактическому RSI», без повторов.
HTF Filter: вкл/выкл, ТФ, уровни для Лонга/Шорта, «только по закрытию», показать HTF-линию.
Алерты
BUY: HTF ok + Setup OK + RSI cross up
SELL: HTF ok + Setup OK + RSI cross down
Сообщения алертов — константные строки (совместимы с Pine).
Перерисовка
Локальные сигналы ставятся на закрытии бара кросса RSI — не перерисовываются.
Дивергенции используют pivot-логику (подтверждаются через lookback) — метка появляется после подтверждения.
HTF-фильтр без перерисовки при включённой опции «Только после закрытия HTF-свечи».
Пример использования
H1 фильтр ≥ 50, M5 Setup 1: дождитесь Bull-дивергенции на M5, затем кросса RSI↑40 в течение N баров — получите BUY.
Для входов без дивергенций выберите Setup 2.
English Description
RSI +WMA+ MA + Div SETUP
All-in-one RSI toolkit: native RSI, RSI-based EMA/WMA, divergence detection, automatic RSI Support/Resistance, price ladder (target prices for chosen RSI levels), and a configurable Higher-Timeframe (HTF) trend filter.
Entry markers are printed exactly at the RSI level cross once the selected setup conditions are met. Includes a No-Repeat option to avoid duplicate signals.
Visuals
RSI, EMA(9) of RSI, WMA(45) of RSI.
Background shading for bull/bear/neutral RSI impulse phases (EMA vs WMA and WMA slope).
▲/▼ phase-change markers (context only, not trade signals).
Regular Bull/Bear divergences with optional labels.
Auto RSI SnR lines from RSI extremes.
WMA SnR points (RSI retests of WMA).
Price ladder: estimated price to reach given RSI levels.
Optional HTF line: WMA(45) of RSI calculated on a higher timeframe.
Trade Signals (BUY/SELL)
Signals plot in the RSI pane at the cross point:
BUY: selected setup satisfied + RSI crosses up the chosen level (default 40) + optional HTF filter passes.
SELL: selected setup satisfied + RSI crosses down the chosen level (default 60) + optional HTF filter passes.
Entry Setups (selector)
Setup 1: Div + Cross — requires a confirmed Bull/Bear divergence and an RSI level cross within a user-defined bar window.
Setup 2: Cross only — RSI level cross only (no divergence required).
HTF Trend Filter
Computes WMA(45) of RSI on a configurable higher timeframe (e.g., 60=H1, 240=H4, D, etc.).
Long allowed if HTF_WMA45 ≥ Long threshold (e.g., 50).
Short allowed if HTF_WMA45 ≤ Short threshold.
“Close-only” option ensures the HTF filter updates only after the HTF bar closes (no repaint).
Key Inputs
RSI length/source; EMA/WMA lengths.
Visual RSI up/down levels & background shading.
Divergence thresholds (RSI ≤ / ≥), labels.
Price ladder: target RSI levels & label spacing.
Auto SnR: three lookback windows, colors.
WMA SnR: retest sensitivity.
Entries: setup selector, divergence window, Long/Short levels (40/60 by default), “mark at actual RSI value”, no-repeat.
HTF Filter: enable, timeframe, Long/Short thresholds, close-only, show HTF line.
Alerts
BUY: HTF ok + Setup OK + RSI cross up
SELL: HTF ok + Setup OK + RSI cross down
Alert messages are constant strings (Pine-compatible).
Repaint Notes
LTF entry signals are placed at bar close when the cross occurs — no repaint.
Divergences rely on pivots; labels plot after confirmation.
HTF filter does not repaint when Close-only is enabled.
Example
H1 filter ≥ 50, M5 Setup 1: wait for a Bull divergence on M5 and an RSI cross up 40 within N bars — you’ll get a BUY.
Choose Setup 2 for cross-only entries.

Average Daily Session Range PRO [Capitalize Labs]Average Daily Session Range PRO
The Average Daily Session Range PRO (ADSR PRO) is a professional-grade analytical tool designed to quantify and visualize the probabilistic range behavior of intraday sessions.
It calculates directional range statistics using historical session data to show how far price typically moves up or down from the session open.
This helps traders understand session volatility profiles, range asymmetry, and probabilistic extensions relative to prior performance.
Key Features
Asymmetric Range Modeling: Separately tracks average upside and downside excursions from each session open, revealing directional bias and volatility imbalance.
Probability Engine Modes: Choose between Rolling Window (fixed-length lookback) and Exponential Decay (weighted historical memory) to control how recent or historic data influences probabilities.
Session-Aware Statistics: Calculates values independently for each defined session, allowing region-specific insights (e.g., Tokyo, London, New York).
Dynamic Range Table: Displays key metrics such as average up/down ticks, expected range extensions, and percentage probabilities.
Adaptive Display: Works across timeframes and instruments, automatically aligning with user-defined session start and end times.
Visual Clarity: Includes clean range markers and labels optimized for both backtesting and live-chart analysis.
Intended Use
ADSR PRO is a statistical reference indicator.
It does not generate buy/sell signals or predictive forecasts.
Its purpose is to help users observe historical session behavior and volatility tendencies to support their own discretionary analysis.
Credits
Developed by Capitalize Labs, specialists in quantitative and discretionary market research tools.
Risk Warning
This material is educational research only and does not constitute financial advice, investment recommendation, or a solicitation to buy or sell any instrument.
Foreign exchange and CFDs are complex, leveraged products that carry a high risk of rapid losses; leverage amplifies both gains and losses, and you should not trade with funds you cannot afford to lose.
Market conditions can change without notice, and news or illiquidity may cause gaps and slippage; stop-loss orders are not guaranteed.
The analysis presented does not take into account your objectives, financial situation, or risk tolerance.
Before acting, assess suitability in light of your circumstances and consider seeking advice from a licensed professional.
Past performance and back-tested or hypothetical scenarios are not reliable indicators of future results, and no outcome or level mentioned here is assured.
You are solely responsible for all trading decisions, including position sizing and risk management.
No external links, promotions, or contact details are provided, in line with TradingView House Rules.
